
In spite of all the uncertainty and challenges going on this year – major wars, inflation, and an extremely contentious election – markets of all flavors enjoyed a robust quarter. It was also a quarter for reversing long-established trends–bonds rallied after a volatile year, and the S&P 500 – long the standout performer among equity sectors – had the lowest return of the major equity indices as the equity bull market “broadened” to include thousands of stocks, not just the Magnificent Seven.1Source: Morningstar Direct. Data as of 9/30/2024.. What led to both stocks and bonds having a strong quarter?
As has been par for the course in these last few years, a lot of it comes down to two things: inflation and the Fed. The August year-over-year CPI reading came in at 2.5%, well below the 2.9% reading in July and the lowest inflation has been since early 20212Cox, Jeff. “Consumer Prices Rose 0.2% in August as Annual Inflation Rate Hits Lowest Since Early 2021.” CNBC, 11 Sept. 2024, www.cnbc.com/2024/09/11/cpi-inflation-report-august-2024-.html.. 2.5% isn’t that far from the Fed’s 2% target, and confidence that the Fed would cut rates in a major way in September grew. Ultimately, the Fed cut rates by 50 bps, a more aggressive move than generally expected, although many were calling for it.
Volatility has continued into October, even with the relatively good news. Of course, it is still too early to tell if high rates for years did lasting damage to the economy, but the timing of the rate cut without some sort of disastrous catalyst was a good sign that we may achieve some form of a soft landing. With this in the background, stocks and bonds alike had strong returns for the quarter, adding to a so far successful year for markets.
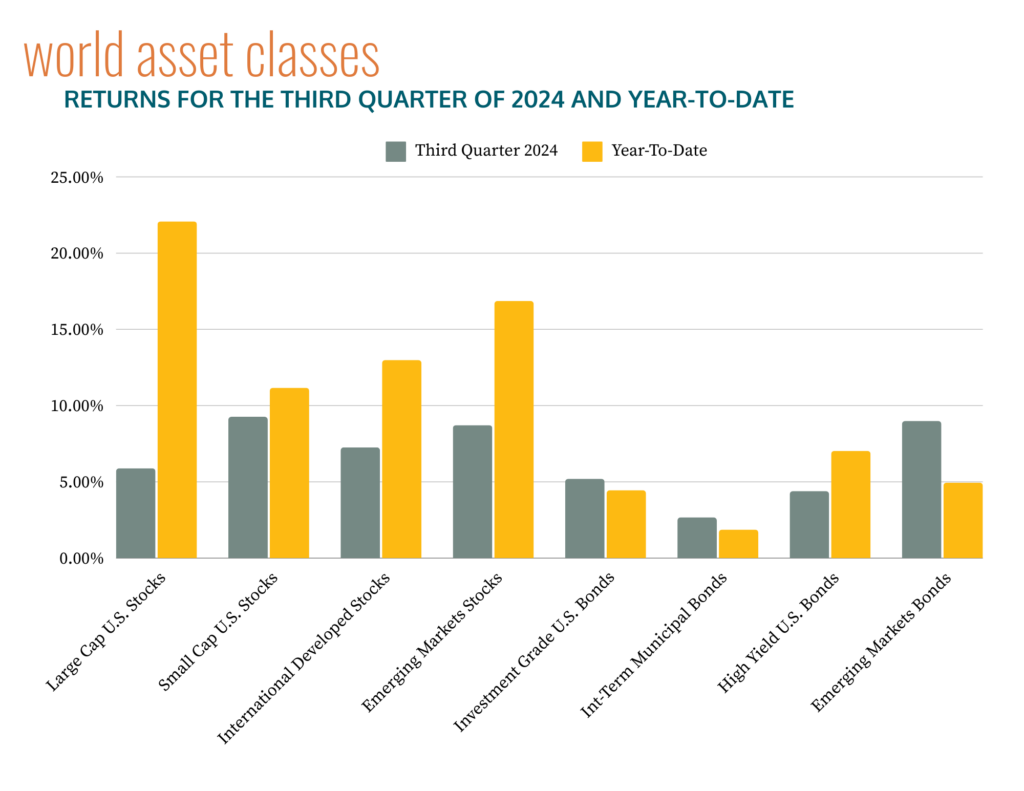
Source: Morningstar Direct and Tamarac Reporting, as of 09/30/2024. Please see important disclosures below.
In a bucking of recent trends, Small Cap stocks led the way, with near double-digit returns in the US after the mega cap tech stocks shone for much of the year. International Developed and Emerging Markets also enjoyed strong returns, helped by the US dollar weakening.
US Large Cap value stocks outperformed their growth stock counterparts by over 6% in the quarter3Source: Morningstar Direct. Data as of 9/30/2024.. Seeing market returns broaden out is a welcome sign after the concerns around concentration and valuation of the mega cap growth stocks that we have discussed ad nauseam in the last two years. Clearly, value stocks need to continue outperforming to catch up, but we may be seeing a style shift now. Only time will tell if the trend continues.
In a somewhat unusual fashion, bonds also enjoyed strong returns while equity markets rallied. The yield on the 10-year Treasury, which started the quarter at 4.36%, came all the way down to 3.81%4“Resource Center | U.S. Department of the Treasury.” U.S. Department of The Treasury, 20 Sept. 2024, home.treasury.gov/resource-center/data-chart-center/interest-rates/TextView?type=daily_treasury_yield_curve&field_tdr_date_value=2024.. Emerging Markets bonds enjoyed the strongest fixed income returns of the quarter, up almost 9%.
It is still too early to tell what the long-term effects of high rates will be on the economy, and there are several conflicts around the world that may have an impact on global markets. However, the economy looks relatively resilient, and the Fed is now cutting – not hiking–so it is possible that inflation comes under control without much more pain. As we mentioned in the second quarter letter (we were discussing Emerging Markets then), returns can come from unexpected places. After struggling for much of the year, US Small Cap stocks took off in the third quarter. Just another reason to be diversified, always.
Important Disclosures
Team Hewins, LLC (“Team Hewins”) is an SEC registered investment adviser; however, such registration does not imply a certain level of skill or training, and no inference to the contrary should be made. We provide this information with the understanding that we are not engaged in rendering legal, accounting, or tax services. We recommend that all investors seek out the services of competent professionals in any of the aforementioned areas.
The volatilities of any comparative indices included in this presentation may be materially different from the individual performance attained by a specific client in a Team Hewins strategy. In addition, client holdings may differ significantly from the securities that comprise the indices. The indices have not been selected to represent an appropriate benchmark to compare an investor’s performance, but rather are disclosed to allow for comparison to the performances of certain well-known and widely recognized indices. The indices are unmanaged, include reinvestment of dividends, capital gain distributions or other earnings and do not reflect any fees or expenses. Indices cannot be invested in directly. Set forth below are descriptions of the indices included in the presentation.
Past performance is not an indication of future returns. Comments provided herein reflects Team Hewins’ views as of the date of this write up and are provided for informational purposes only. Such views are subject to change at any point without notice. Some of the information was obtained from third party sources believed to be reliable but the information is not guaranteed. Any forward-looking statements or forecasts are based on assumptions and actual results are expected to vary from any such statements or forecasts. Due to various risks and uncertainties no reliance should be placed on any such statements or forecasts when making any investment decision. Nothing presented herein is or intended to be investment advice or a recommendation to buy or sell any securities and no investment decision should be made based solely on the information provided. Team Hewins is not responsible for the consequences of any decisions or actions taken as a result of information provided in this writeup and does not warrant or guarantee the accuracy or completeness of the information. There is a risk of loss from an investment in securities, including the risk of loss of principal. Different types of investments involve varying degrees of risk, and there can be no assurance that any specific investment will be profitable or suitable for a particular investor’s financial situation or risk tolerance. Asset allocation and portfolio diversification cannot assure or guarantee better performance and cannot eliminate the risk of investment losses.
Source: © [2023] Morningstar. All Rights Reserved. The information contained herein: (1) is proprietary to Morningstar and/or its content providers; (2) may not be copied or distributed; and (3) is not warranted to be accurate, complete or timely. Neither Morningstar nor its content providers are responsible for any damages or losses arising.
Index returns for JPM GBI EM GD USD Unhedged Index (Emerging Markets Bonds) sourced from Tamarac Reporting and JP Morgan.
Index Descriptions
-
S&P 500 Index (Large Cap U.S. Stocks): measures the performance of large capitalization U.S. Stocks. It is a market-value-weighted index of 500 stocks that are traded on the NYSE, NYSE MKT, and NASDAQ. The weightings make each company’s influence on the Index performance directly proportional to that company’s market value.
-
Russell 2000 Index (Small Cap U.S. Stocks): An unmanaged index that measures the performance of the small-cap segment of the U.S. equity universe. It is a subset of the Russell 3000 Index, representing approximately 10% of the total market capitalization of that index and includes approximately 2,000 of the smallest securities based on a combination of their market cap and current index membership. Russell Investment Group owns the Russell Index data, including all applicable trademarks and copyrights.
-
MSCI EAFE Index (International Developed Stocks): The MSCI EAFE Index (Europe, Australasia, Far East) is a free float-adjusted market capitalization-weighted index that is designed to measure the equity market performance of developed markets, excluding the U.S. & Canada. The MSCI EAFE Index consists of the following 22 developed market country indices: Australia, Austria, Belgium, Denmark, Finland, France, Germany, Greece, Hong Kong, Ireland, Israel, Italy, Japan, the Netherlands, New Zealand, Norway, Portugal, Singapore, Spain, Sweden, Switzerland, and the United Kingdom.
-
MSCI Emerging Markets Index (Emerging Markets Stocks): is a Morgan Stanley Capital International Index that is designed to measure the performance of equity markets in 25 emerging countries around the world.
-
Bloomberg Barclays US Aggregate Bond Index (Investment Grade U.S. Bonds): includes U.S. government, corporate, and mortgage-backed securities with maturities of at least one year.
-
Bloomberg Barclays Muni Bond Index 1-10 Yr Blend (1-12) (Int-Term Municipal Bonds): A market value-weighted index which covers the short and intermediate components of the Barclays Capital Municipal Bond Index. The 1-10 Year Municipal Blend index tracks tax-exempt municipal General Obligation, Revenue, Insured, and Prerefunded bonds with a minimum $5 million par amount outstanding, issued as part of a transaction of at least $50 million, and with a remaining maturity from 1 up to (but not including) 12 years.
-
ICE BofA Merrill Lynch U.S. High Yield, BB-B Rated, Constrained Index (High Yield U.S. Bonds): Tracks the performance of US dollar-denominated below-investment-grade (BBB rated) corporate debt publicly issued in the US domestic market. Qualifying bonds are capitalization-weighted provided the total allocation to an individual issuer does not exceed 2%. Issuers that exceed the limit are reduced to 2% and the face value of each of their bonds is adjusted on a pro-rata basis.
-
JPM GBI EM GD USD Unhedged Index (Emerging Markets Bonds): The JP Morgan EMBI Global Diversified is a uniquely weighted index that tracks total returns for U.S. dollar-denominated Brady bonds, Eurobonds, traded loans, and local market debt instruments issued by sovereign and quasi-sovereign entities. The index limits the weights of countries with larger debt stocks by only including a specified portion of these countries’ eligible current face amounts of debt outstanding.
- 1Source: Morningstar Direct. Data as of 9/30/2024.
- 2Cox, Jeff. “Consumer Prices Rose 0.2% in August as Annual Inflation Rate Hits Lowest Since Early 2021.” CNBC, 11 Sept. 2024, www.cnbc.com/2024/09/11/cpi-inflation-report-august-2024-.html.
- 3Source: Morningstar Direct. Data as of 9/30/2024.
- 4“Resource Center | U.S. Department of the Treasury.” U.S. Department of The Treasury, 20 Sept. 2024, home.treasury.gov/resource-center/data-chart-center/interest-rates/TextView?type=daily_treasury_yield_curve&field_tdr_date_value=2024.