
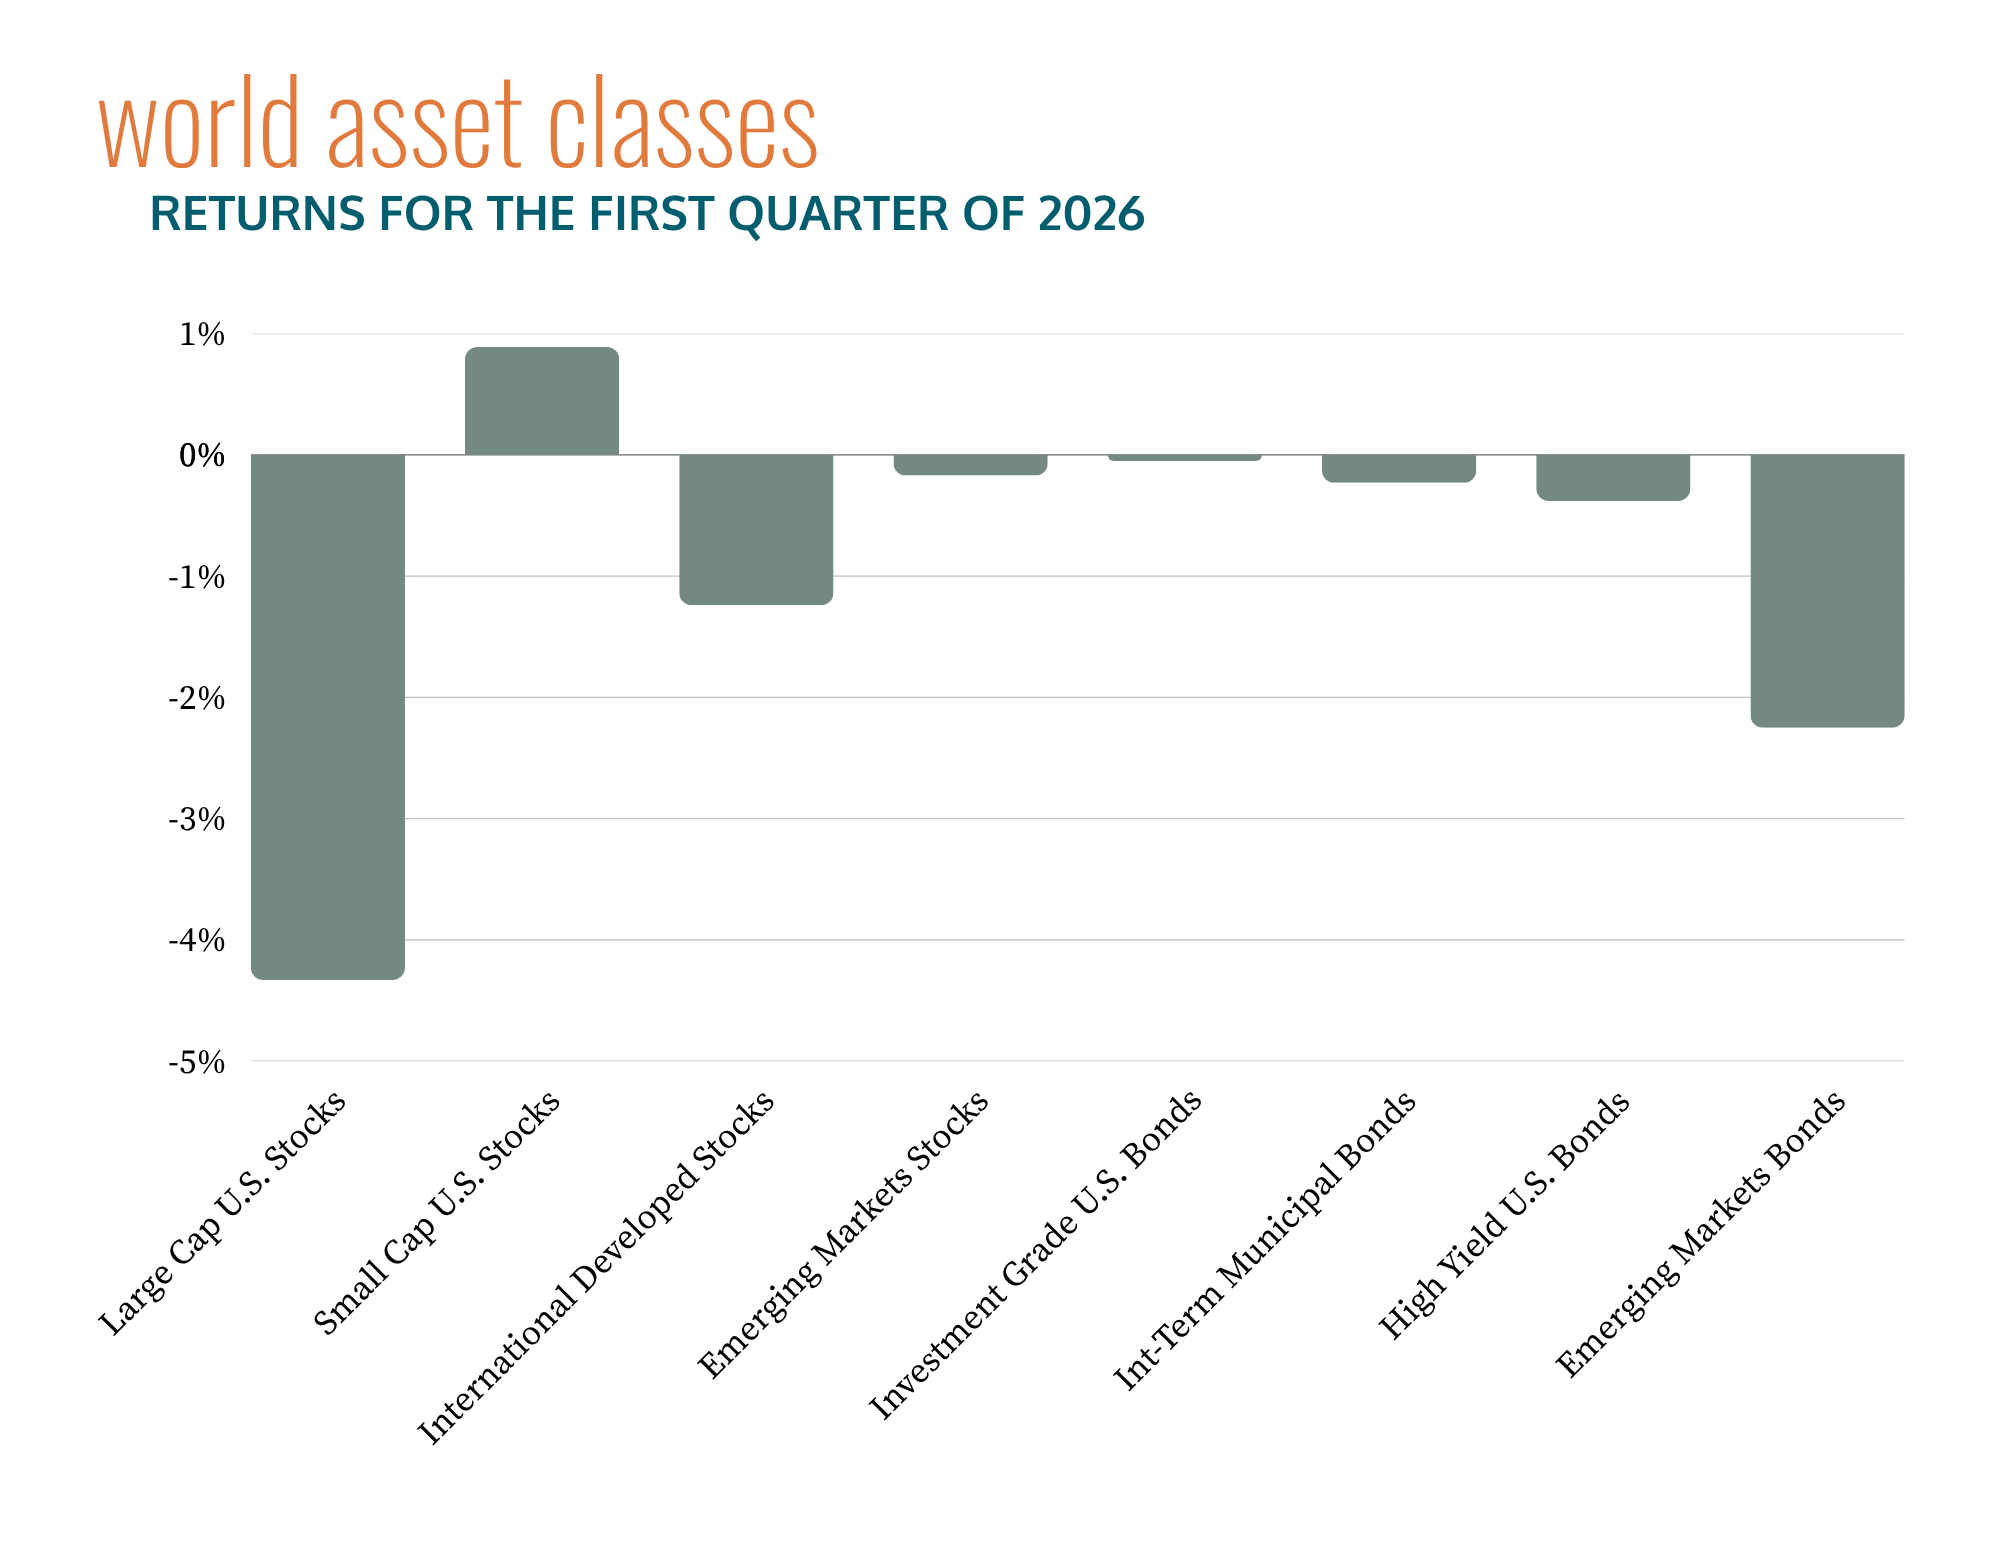
After a strong start to the year, markets retreated in a volatile March behind concerns around the conflict with Iran, the impact of higher oil prices and inflation trending above the Fed’s 2% target. Despite the volatile backdrop, the factors did relatively better, with value stocks outperforming their expensive MegaCap growth tech stock counterparts and US Small Cap stocks being the lone positive asset class on the chart below.
As a consequence of the conflict with Iran and the closing of the Strait of Hormuz, the price of crude oil rose to over $100 a barrel, the first time since 2022.1Meredith, Sam, et al. “Brent Oil Heads for Record Monthly Surge, WTI Settles Above $100 for First Time Since 2022.” CNBC, 30 Mar. 2026, www.cnbc.com/2026/03/30/oil-price-today-wti-brent-yemen-houthis-israel-iran-war.html. Going into this conflict, CPI was relatively steady in February at 2.4% year-over-year, the same as the previous month while being modestly above the Fed’s target of 2%.2Cox, Jeff. “Consumer Prices Rose 2.4% Annually in February, as Expected.” CNBC, 11 Mar. 2026, www.cnbc.com/2026/03/11/cpi-inflation-report-february-2026.html.
Despite these concerns, markets were not down in any significant way outside of US Large Cap stocks, with most asset classes basically flat for the quarter with US Small Cap stocks leading the way.
Source: Tamarac Reporting, Morningstar Direct and JP Morgan, as of 03/31/2026. Please see important disclosures below.
Value stocks led their growth counterparts across the board, posting positive returns while growth stocks were negative for the quarter.3Source: Morningstar Direct as of 3/31/2026.
For bonds, yields rose in early March as oil prices climbed, which dampened returns. Despite this, high credit-quality bonds (including municipal bonds) ended the quarter flat. High yield bonds were down only slightly. A rising US dollar depressed foreign bonds’ returns, which were modestly down after posting a near-20% return in 2025.
The conflict with Iran took center stage in the final month of the quarter and it could continue to drive market movements until these issues are resolved. However, this could change quickly with good news, as we saw on the first day of April.4Berwick, Angus. “Stock Market News, April 1, 2026: Dow Advances on Hopes for Quick End to War.” The Wall Street Journal, 1 Apr. 2026, www.wsj.com/livecoverage/stock-market-today-dow-sp-500-nasdaq-04-01-2026. Even with a down month, the quarter saw relatively flat returns and investors exposed to the factors fared relatively better than the market as a whole. While there is no way to know when the conflict with Iran will end, clients who stay disciplined will benefit when markets do recover.
Important Disclosures
Team Hewins, LLC (“Team Hewins”) is an SEC registered investment adviser; however, such registration does not imply a certain level of skill or training, and no inference to the contrary should be made. We provide this information with the understanding that we are not engaged in rendering legal, accounting, or tax services. We recommend that all investors seek out the services of competent professionals in any of the aforementioned areas.
The volatilities of any comparative indices included in this presentation may be materially different from the individual performance attained by a specific client in a Team Hewins strategy. In addition, client holdings may differ significantly from the securities that comprise the indices. The indices have not been selected to represent an appropriate benchmark to compare an investor’s performance, but rather are disclosed to allow for comparison to the performances of certain well-known and widely recognized indices. The indices are unmanaged, include reinvestment of dividends, capital gain distributions or other earnings and do not reflect any fees or expenses. Indices cannot be invested in directly. Set forth below are descriptions of the indices included in the presentation.
Past performance is not an indication of future returns. Comments provided herein reflects Team Hewins’ views as of the date of this write up and are provided for informational purposes only. Such views are subject to change at any point without notice. Some of the information was obtained from third party sources believed to be reliable but the information is not guaranteed. Any forward-looking statements or forecasts are based on assumptions and actual results are expected to vary from any such statements or forecasts. Due to various risks and uncertainties no reliance should be placed on any such statements or forecasts when making any investment decision. Nothing presented herein is or intended to be investment advice or a recommendation to buy or sell any securities and no investment decision should be made based solely on the information provided. Team Hewins is not responsible for the consequences of any decisions or actions taken as a result of information provided in this writeup and does not warrant or guarantee the accuracy or completeness of the information. There is a risk of loss from an investment in securities, including the risk of loss of principal. Different types of investments involve varying degrees of risk, and there can be no assurance that any specific investment will be profitable or suitable for a particular investor’s financial situation or risk tolerance. Asset allocation and portfolio diversification cannot assure or guarantee better performance and cannot eliminate the risk of investment losses.
Source: © [2026] Morningstar. All Rights Reserved. The information contained herein: (1) is proprietary to Morningstar and/or its content providers; (2) may not be copied or distributed; and (3) is not warranted to be accurate, complete or timely. Neither Morningstar nor its content providers are responsible for any damages or losses arising.
Index returns for JPM GBI EM GD USD Unhedged Index (Emerging Markets Bonds) sourced from Tamarac Reporting and JP Morgan.
Index Descriptions
-
S&P 500 Index (Large Cap U.S. Stocks): measures the performance of large capitalization U.S. Stocks. It is a market-value-weighted index of 500 stocks that are traded on the NYSE, NYSE MKT, and NASDAQ. The weightings make each company’s influence on the Index performance directly proportional to that company’s market value.
-
Russell 2000 Index (Small Cap U.S. Stocks): An unmanaged index that measures the performance of the small-cap segment of the U.S. equity universe. It is a subset of the Russell 3000 Index, representing approximately 10% of the total market capitalization of that index and includes approximately 2,000 of the smallest securities based on a combination of their market cap and current index membership. Russell Investment Group owns the Russell Index data, including all applicable trademarks and copyrights.
-
MSCI EAFE Index (International Developed Stocks): The MSCI EAFE Index (Europe, Australasia, Far East) is a free float-adjusted market capitalization-weighted index that is designed to measure the equity market performance of developed markets, excluding the U.S. & Canada. The MSCI EAFE Index consists of the following 22 developed market country indices: Australia, Austria, Belgium, Denmark, Finland, France, Germany, Greece, Hong Kong, Ireland, Israel, Italy, Japan, the Netherlands, New Zealand, Norway, Portugal, Singapore, Spain, Sweden, Switzerland, and the United Kingdom.
-
MSCI Emerging Markets Index (Emerging Markets Stocks): is a Morgan Stanley Capital International Index that is designed to measure the performance of equity markets in 25 emerging countries around the world.
-
Bloomberg US Aggregate Bond Index (Investment Grade U.S. Bonds): includes U.S. government, corporate, and mortgage-backed securities with maturities of at least one year.
-
Bloomberg Muni Bond Index 1-10 Yr Blend (1-12) (Int-Term Municipal Bonds): A market value-weighted index which covers the short and intermediate components of the broader Bloomberg Capital Municipal Bond Index. The 1-10 Year Municipal Blend index tracks tax-exempt municipal General Obligation, Revenue, Insured, and Prerefunded bonds with a minimum $5 million par amount outstanding, issued as part of a transaction of at least $50 million, and with a remaining maturity from 1 up to (but not including) 12 years.
-
ICE BofA Merrill Lynch U.S. High Yield, BB-B Rated, Constrained Index (High Yield U.S. Bonds): Tracks the performance of US dollar-denominated below-investment-grade (BBB rated) corporate debt publicly issued in the US domestic market. Qualifying bonds are capitalization-weighted provided the total allocation to an individual issuer does not exceed 2%. Issuers that exceed the limit are reduced to 2% and the face value of each of their bonds is adjusted on a pro-rata basis.
-
JPM GBI EM GD USD Unhedged Index (Emerging Markets Bonds): A comprehensive global local emerging markets index that consists of regularly traded, liquid fixed-rate domestic currency government bonds.
- 1Meredith, Sam, et al. “Brent Oil Heads for Record Monthly Surge, WTI Settles Above $100 for First Time Since 2022.” CNBC, 30 Mar. 2026, www.cnbc.com/2026/03/30/oil-price-today-wti-brent-yemen-houthis-israel-iran-war.html.
- 2Cox, Jeff. “Consumer Prices Rose 2.4% Annually in February, as Expected.” CNBC, 11 Mar. 2026, www.cnbc.com/2026/03/11/cpi-inflation-report-february-2026.html.
- 3Source: Morningstar Direct as of 3/31/2026.
- 4Berwick, Angus. “Stock Market News, April 1, 2026: Dow Advances on Hopes for Quick End to War.” The Wall Street Journal, 1 Apr. 2026, www.wsj.com/livecoverage/stock-market-today-dow-sp-500-nasdaq-04-01-2026.