
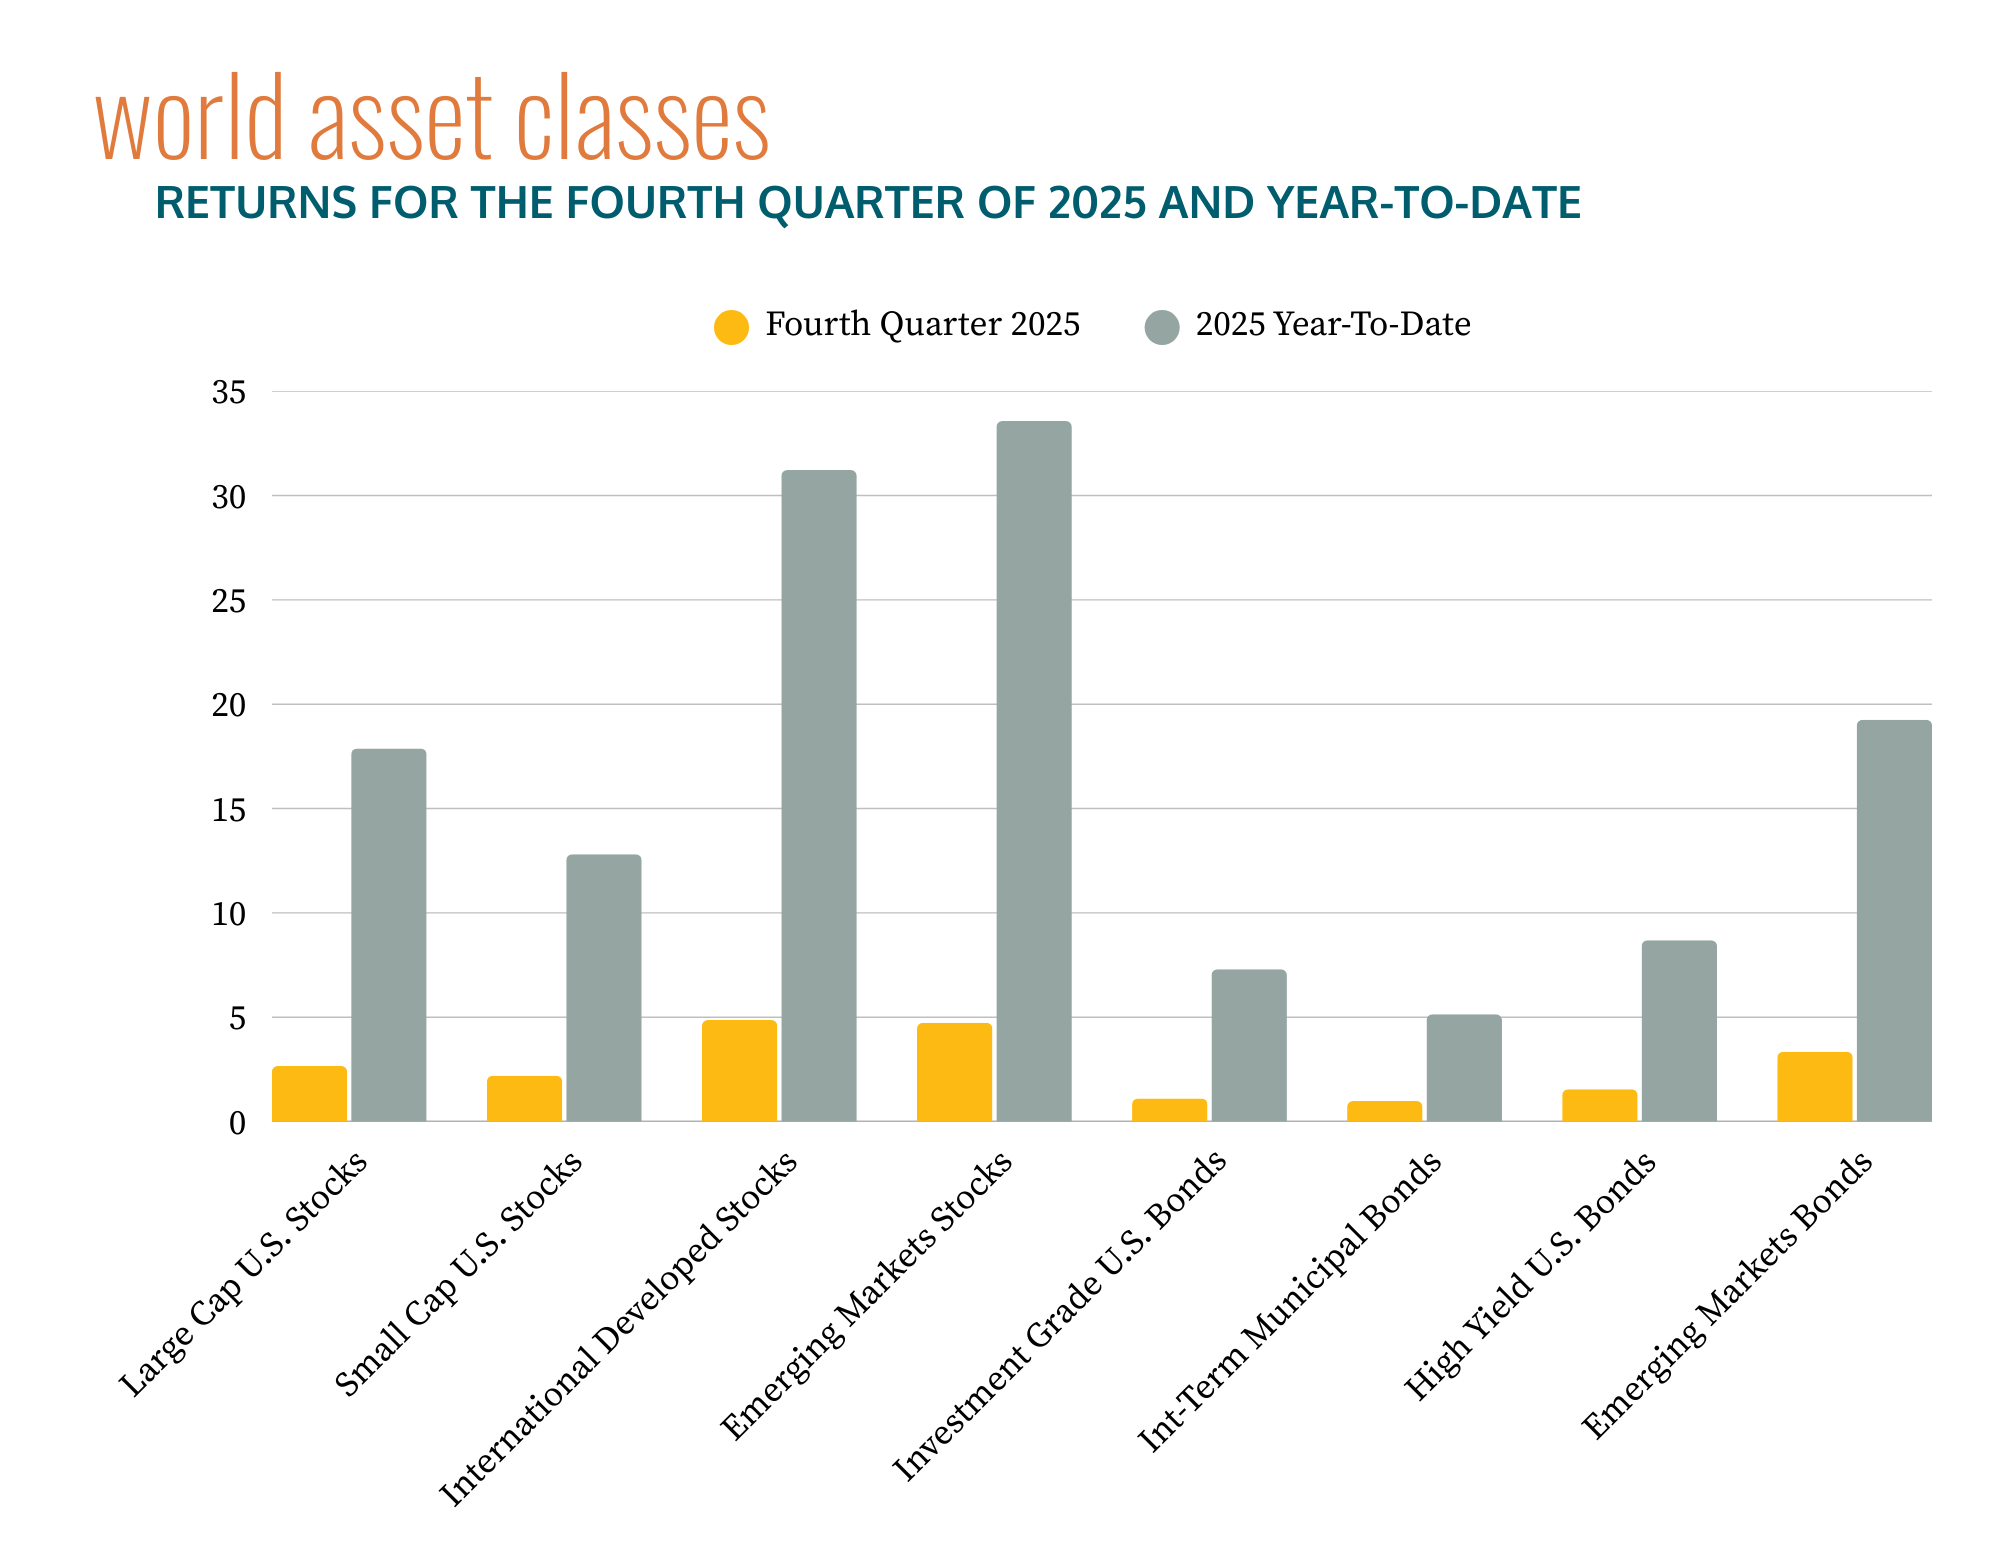
International and Emerging Markets stocks were the best performers for Q4 and the full year, aided by a decline in the US dollar of about 9%, but nonetheless based on solid performance of the underlying equity markets denominated in local currencies. Both were up more than 30% for the full year, their best performance in a long time.1Demos, Telis. “Global Stocks’ Great Year Was About More Than the Dollar.” The Wall Street Journal, 2 Jan. 2026, www.wsj.com/finance/global-stocks-great-year-was-about-more-than-the-dollar-9cf7e19c?st=sQrrA6&reflink=desktopwebshare_permalink.
As we have emphasized recently, International and Emerging Markets equities, which have underperformed the S&P 500 the last few years, were considerably less expensive by traditional measures (e.g., price/earnings ratios). This year they had room for some recovery and narrowed that gap, but they remain significantly less expensive, and we recommend remaining well diversified, maintaining the target weighting in all equity asset classes.
The S&P 500 faltered out of the gate earlier this past year but recovered nicely to return almost 18% for the year. US Small Cap stocks also performed well, returning almost 13%.
Source: Tamarac Reporting, Morningstar Direct and JP Morgan, as of 12/31/2025. Please see important disclosures below.
In fixed income, two factors were most important. First, interest rates in the US declined, with the 10-Year Treasury yielding less than 4.2% at year-end. Thus, investment grade and Muni bonds rallied, with the Bloomberg US Aggregate Bond Index returning 7.3%. Second, the US dollar declined in value, as mentioned above, adding substantially to the returns of foreign and Emerging Markets bonds.2“Treasury Yields Have Mixed Weekly Performance Ahead of Labor Data.” The Wall Street Journal, 2 Jan. 2026, www.wsj.com/finance/u-s-treasury-yields-rise-as-trading-kicks-off-in-europe-5c1390e1?st=pGPzPx&reflink=desktopwebshare_permalink.
AI was the big story this year and seems likely to continue to dominate the headlines for some time to come. The amount of capital being invested in data centers to support AI is truly staggering, but this year equity markets produced returns in many sectors and regions, not just the Magnificent Seven stocks. Going forward it is clear AI will have major impacts on markets and economies, but who will benefit most and what the markets will do next remain unclear, as always.
Important Disclosures
Team Hewins, LLC (“Team Hewins”) is an SEC registered investment adviser; however, such registration does not imply a certain level of skill or training, and no inference to the contrary should be made. We provide this information with the understanding that we are not engaged in rendering legal, accounting, or tax services. We recommend that all investors seek out the services of competent professionals in any of the aforementioned areas.
The volatilities of any comparative indices included in this presentation may be materially different from the individual performance attained by a specific client in a Team Hewins strategy. In addition, client holdings may differ significantly from the securities that comprise the indices. The indices have not been selected to represent an appropriate benchmark to compare an investor’s performance, but rather are disclosed to allow for comparison to the performances of certain well-known and widely recognized indices. The indices are unmanaged, include reinvestment of dividends, capital gain distributions or other earnings and do not reflect any fees or expenses. Indices cannot be invested in directly. Set forth below are descriptions of the indices included in the presentation.
Past performance is not an indication of future returns. Comments provided herein reflects Team Hewins’ views as of the date of this write up and are provided for informational purposes only. Such views are subject to change at any point without notice. Some of the information was obtained from third party sources believed to be reliable but the information is not guaranteed. Any forward-looking statements or forecasts are based on assumptions and actual results are expected to vary from any such statements or forecasts. Due to various risks and uncertainties no reliance should be placed on any such statements or forecasts when making any investment decision. Nothing presented herein is or intended to be investment advice or a recommendation to buy or sell any securities and no investment decision should be made based solely on the information provided. Team Hewins is not responsible for the consequences of any decisions or actions taken as a result of information provided in this writeup and does not warrant or guarantee the accuracy or completeness of the information. There is a risk of loss from an investment in securities, including the risk of loss of principal. Different types of investments involve varying degrees of risk, and there can be no assurance that any specific investment will be profitable or suitable for a particular investor’s financial situation or risk tolerance. Asset allocation and portfolio diversification cannot assure or guarantee better performance and cannot eliminate the risk of investment losses.
Source: © [2025] Morningstar. All Rights Reserved. The information contained herein: (1) is proprietary to Morningstar and/or its content providers; (2) may not be copied or distributed; and (3) is not warranted to be accurate, complete or timely. Neither Morningstar nor its content providers are responsible for any damages or losses arising.
Index returns for JPM GBI EM GD USD Unhedged Index (Emerging Markets Bonds) sourced from Tamarac Reporting and JP Morgan.
Index Descriptions
-
S&P 500 Index (Large Cap U.S. Stocks): measures the performance of large capitalization U.S. Stocks. It is a market-value-weighted index of 500 stocks that are traded on the NYSE, NYSE MKT, and NASDAQ. The weightings make each company’s influence on the Index performance directly proportional to that company’s market value.
-
Russell 2000 Index (Small Cap U.S. Stocks): An unmanaged index that measures the performance of the small-cap segment of the U.S. equity universe. It is a subset of the Russell 3000 Index, representing approximately 10% of the total market capitalization of that index and includes approximately 2,000 of the smallest securities based on a combination of their market cap and current index membership. Russell Investment Group owns the Russell Index data, including all applicable trademarks and copyrights.
-
MSCI EAFE Index (International Developed Stocks): The MSCI EAFE Index (Europe, Australasia, Far East) is a free float-adjusted market capitalization-weighted index that is designed to measure the equity market performance of developed markets, excluding the U.S. & Canada. The MSCI EAFE Index consists of the following 22 developed market country indices: Australia, Austria, Belgium, Denmark, Finland, France, Germany, Greece, Hong Kong, Ireland, Israel, Italy, Japan, the Netherlands, New Zealand, Norway, Portugal, Singapore, Spain, Sweden, Switzerland, and the United Kingdom.
-
MSCI Emerging Markets Index (Emerging Markets Stocks): is a Morgan Stanley Capital International Index that is designed to measure the performance of equity markets in 25 emerging countries around the world.
-
Bloomberg US Aggregate Bond Index (Investment Grade U.S. Bonds): includes U.S. government, corporate, and mortgage-backed securities with maturities of at least one year.
-
Bloomberg Muni Bond Index 1-10 Yr Blend (1-12) (Int-Term Municipal Bonds): A market value-weighted index which covers the short and intermediate components of the broader Bloomberg Capital Municipal Bond Index. The 1-10 Year Municipal Blend index tracks tax-exempt municipal General Obligation, Revenue, Insured, and Prerefunded bonds with a minimum $5 million par amount outstanding, issued as part of a transaction of at least $50 million, and with a remaining maturity from 1 up to (but not including) 12 years.
-
ICE BofA Merrill Lynch U.S. High Yield, BB-B Rated, Constrained Index (High Yield U.S. Bonds): Tracks the performance of US dollar-denominated below-investment-grade (BBB rated) corporate debt publicly issued in the US domestic market. Qualifying bonds are capitalization-weighted provided the total allocation to an individual issuer does not exceed 2%. Issuers that exceed the limit are reduced to 2% and the face value of each of their bonds is adjusted on a pro-rata basis.
-
JPM GBI EM GD USD Unhedged Index (Emerging Markets Bonds): A comprehensive global local emerging markets index that consists of regularly traded, liquid fixed-rate domestic currency government bonds.
- 1Demos, Telis. “Global Stocks’ Great Year Was About More Than the Dollar.” The Wall Street Journal, 2 Jan. 2026, www.wsj.com/finance/global-stocks-great-year-was-about-more-than-the-dollar-9cf7e19c?st=sQrrA6&reflink=desktopwebshare_permalink.
- 2“Treasury Yields Have Mixed Weekly Performance Ahead of Labor Data.” The Wall Street Journal, 2 Jan. 2026, www.wsj.com/finance/u-s-treasury-yields-rise-as-trading-kicks-off-in-europe-5c1390e1?st=pGPzPx&reflink=desktopwebshare_permalink.