
2023 has seen robust returns in the first half of the year, with a significant pullback in the third quarter. In the second quarter letter, we mentioned that markets continued to be strong in spite of lingering concerns. In the third quarter, those concerns had not gone away, and in some ways, had gotten worse, as the markets started to believe the Fed that rates were going to remain “higher for longer.”
Headline inflation has risen back to 3.7% year-over-year (after falling to 3%). (1) The price of a barrel of oil has risen all the way back above $90 behind continued production cuts by OPEC and Russia. (2) Interest rates rose sharply, with the two-year Treasury yielding 5.05% and the 10-year yielding 4.73%; the yield curve remains inverted. (3)
Investors had initially predicted that the Federal Reserve would lower rates sooner, possibly as soon as the end of this year, but now it is looking as if rates will indeed stay higher for longer. Higher rates for longer increases the chance that the US economy, which has been incredibly resilient to this point, goes into recession after all. Uncertainty and rising yields contributed to a sharp downturn for both stocks and bonds in the third quarter.
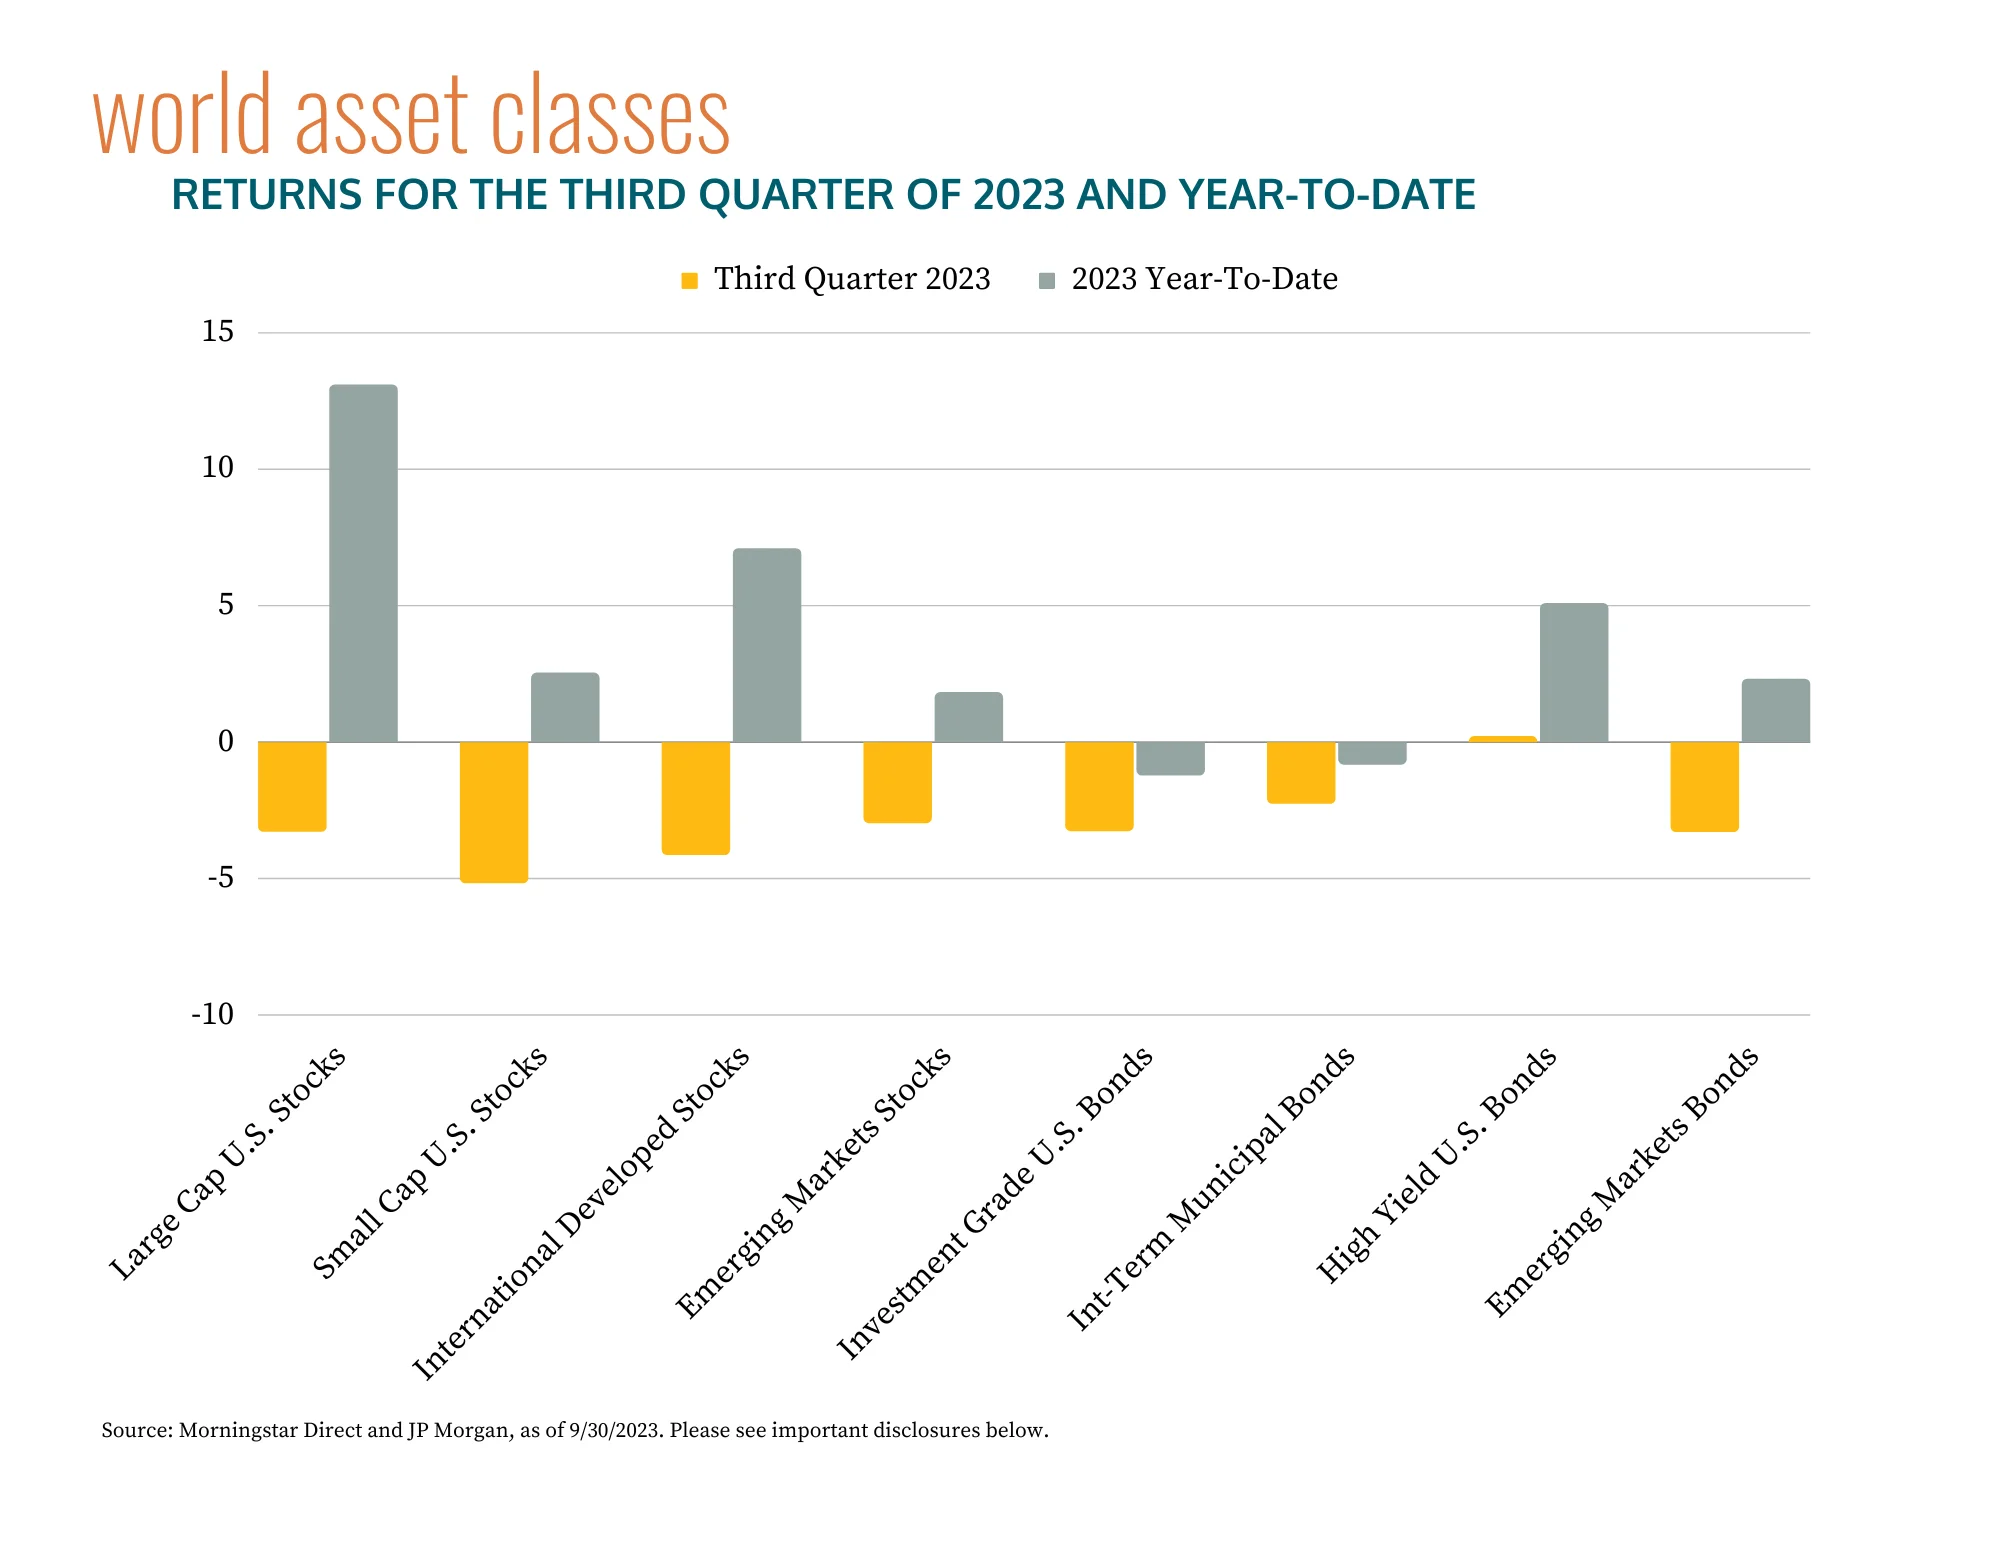
In both the US and abroad, large cap stocks are faring better, especially large cap growth stocks in the US, which has again been the one bright spot in a difficult market. That being said, they appear quite expensive now compared to all other equities. Overseas, value stocks had a better quarter and year than growth stocks.
CNN’s Fear & Greed Index is in the “extreme fear” range, showing that investors are concerned about the markets. Smaller cap stocks, which generally have less capital to withstand a recession and which may not be able to obtain bank lending, were down 5% in the quarter. (4) No one knows when this uncertainty will abate, but small cap stocks tend to recover more quickly than their larger counterparts, and markets tend to recover after sentiment drops to new lows. (5)
The bond market is also beginning to believe that rates will remain higher for longer. After hovering around 4% for much of the third quarter, the yield on the 10-year Treasury bond rose to as much as 4.81% as of October 3rd. (6) High yield bonds, which tend to be less susceptible to interest rate movements, had the lone positive return on the graph above.
Stepping away from the concerns mentioned at the beginning of this letter, there may be opportunities borne out of this market environment. Valuations for large US stocks, which had reached a multi-decade high in 2021, have begun to drift down closer to their long-term averages. (7) If bond yields fall from here, bondholders who did not go to short-term bonds or cash will see their bonds increase in value. We believe that investors who maintain discipline through the current landscape have the best chance of achieving success in the coming years.
[1] Marley Jay, “August Inflation Grew 3.7% From a Year Ago.” NBC News, 13 Sept. 2023, www.nbcnews.com/business/economy/inflation-august-2023-number-will-interest-rates-keep-going-up-rcna104655. Accessed 10/4/23.
[2] Dahan, Maha, and Vladimir Soldatkin. “Saudi Arabia, Russia to Continue Voluntary Oil Cuts.” Reuters, 4 Oct. 2023, www.reuters.com/business/energy/saudi-arabia-continue-voluntary-cut-one-million-bpd-2023-10-04. Accessed 10/4/23.
[3] Rappeport, Alan, and Joe Rennison. “U.S. Credit Rating Is Downgraded by Fitch.” The New York Times, 2 Aug. 2023, www.nytimes.com/2023/08/01/business/fitch-downgrade-us-credit-rating.html. Accessed 10/4/23.
[4] CNN “Fear and Greed Index.” CNN, 5 Oct. 2023, https://www.cnn.com/markets/fear-and-greed. Accessed 10/4/23.
[5] “Consumer confidence and the stock market.” JPMorgan Guide to the Markets, slide 24. As of 10/3/23.
[6] Source: Treasury.gov. Data as of 10/4/23.
[7] “S&P 500 valuation measures” JPMorgan Guide to the Markets, slide 5. As of 10/3/23.
Important Disclosures
Team Hewins, LLC (“Team Hewins”) is an SEC registered investment adviser; however, such registration does not imply a certain level of skill or training, and no inference to the contrary should be made. We provide this information with the understanding that we are not engaged in rendering legal, accounting, or tax services. We recommend that all investors seek out the services of competent professionals in any of the aforementioned areas.
The volatilities of any comparative indices included in this presentation may be materially different from the individual performance attained by a specific client in a Team Hewins strategy. In addition, client holdings may differ significantly from the securities that comprise the indices. The indices have not been selected to represent an appropriate benchmark to compare an investor’s performance, but rather are disclosed to allow for comparison to the performances of certain well-known and widely recognized indices. The indices are unmanaged, include reinvestment of dividends, capital gain distributions or other earnings and do not reflect any fees or expenses. Indices cannot be invested in directly. Set forth below are descriptions of the indices included in the presentation.
Past performance is not an indication of future returns. Comments provided herein reflects Team Hewins’ views as of the date of this write up and are provided for informational purposes only. Such views are subject to change at any point without notice. Some of the information was obtained from third party sources believed to be reliable but the information is not guaranteed. Any forward-looking statements or forecasts are based on assumptions and actual results are expected to vary from any such statements or forecasts. Due to various risks and uncertainties no reliance should be placed on any such statements or forecasts when making any investment decision. Nothing presented herein is or intended to be investment advice or a recommendation to buy or sell any securities and no investment decision should be made based solely on the information provided. Team Hewins is not responsible for the consequences of any decisions or actions taken as a result of information provided in this writeup and does not warrant or guarantee the accuracy or completeness of the information. There is a risk of loss from an investment in securities, including the risk of loss of principal. Different types of investments involve varying degrees of risk, and there can be no assurance that any specific investment will be profitable or suitable for a particular investor’s financial situation or risk tolerance. Asset allocation and portfolio diversification cannot assure or guarantee better performance and cannot eliminate the risk of investment losses.
Source: © [2023] Morningstar. All Rights Reserved. The information contained herein: (1) is proprietary to Morningstar and/or its content providers; (2) may not be copied or distributed; and (3) is not warranted to be accurate, complete or timely. Neither Morningstar nor its content providers are responsible for any damages or losses arising.
Index Descriptions
-
S&P 500 Index (Large Cap U.S. Stocks): measures the performance of large capitalization U.S. Stocks. It is a market-value-weighted index of 500 stocks that are traded on the NYSE, NYSE MKT, and NASDAQ. The weightings make each company’s influence on the Index performance directly proportional to that company’s market value.
-
Russell 2000 Index (Small Cap U.S. Stocks): An unmanaged index that measures the performance of the small-cap segment of the U.S. equity universe. It is a subset of the Russell 3000 Index, representing approximately 10% of the total market capitalization of that index and includes approximately 2,000 of the smallest securities based on a combination of their market cap and current index membership. Russell Investment Group owns the Russell Index data, including all applicable trademarks and copyrights.
-
MSCI EAFE Index (International Developed Stocks): The MSCI EAFE Index (Europe, Australasia, Far East) is a free float-adjusted market capitalization-weighted index that is designed to measure the equity market performance of developed markets, excluding the U.S. & Canada. The MSCI EAFE Index consists of the following 22 developed market country indices: Australia, Austria, Belgium, Denmark, Finland, France, Germany, Greece, Hong Kong, Ireland, Israel, Italy, Japan, the Netherlands, New Zealand, Norway, Portugal, Singapore, Spain, Sweden, Switzerland, and the United Kingdom.
-
MSCI Emerging Markets Index (Emerging Markets Stocks): is a Morgan Stanley Capital International Index that is designed to measure the performance of equity markets in 25 emerging countries around the world.
-
Bloomberg Barclays US Aggregate Bond Index (Investment Grade U.S. Bonds): includes U.S. government, corporate, and mortgage-backed securities with maturities of at least one year.
-
Bloomberg Barclays Muni Bond Index 1-10 Yr Blend (1-12) (Int-Term Municipal Bonds): A market value-weighted index which covers the short and intermediate components of the Barclays Capital Municipal Bond Index. The 1-10 Year Municipal Blend index tracks tax-exempt municipal General Obligation, Revenue, Insured, and Prerefunded bonds with a minimum $5 million par amount outstanding, issued as part of a transaction of at least $50 million, and with a remaining maturity from 1 up to (but not including) 12 years.
-
ICE BofA Merrill Lynch U.S. High Yield, BB-B Rated, Constrained Index (High Yield U.S. Bonds): Tracks the performance of US dollar-denominated below-investment-grade (BBB rated) corporate debt publicly issued in the US domestic market. Qualifying bonds are capitalization-weighted provided the total allocation to an individual issuer does not exceed 2%. Issuers that exceed the limit are reduced to 2% and the face value of each of their bonds is adjusted on a pro-rata basis.
-
JPM GBI EM GD USD Unhedged Index (Emerging Markets Bonds): The JP Morgan EMBI Global Diversified is a uniquely weighted index that tracks total returns for U.S. dollar-denominated Brady bonds, Eurobonds, traded loans, and local market debt instruments issued by sovereign and quasi-sovereign entities. The index limits the weights of countries with larger debt stocks by only including a specified portion of these countries’ eligible current face amounts of debt outstanding.