
Mounting concerns around the impact of escalating tariff policies on inflation and weakening economic data drove a negative first quarter for US equities, a trend that worsened in April as a new set of tariffs were announced. As of April 8th, the S&P 500 had fallen 15% for the year.1Source: Morningstar Direct. Data as of 6/30/2025. Inflation continued to appear sticky, with Core PCE (Personal Consumption Expenditures Price Index), the Fed’s favorite measure, rising to 2.7% year-over-year, not moving closer to the Fed’s 2% target.2Cox, Jeff. “Core Inflation Rate Rose to 2.7% in May, More Than Expected, Fed’s Preferred Gauge Shows.” CNBC, 27 June 2025, www.cnbc.com/2025/06/27/pce-inflation-report-may-2025-.html. Then US equities saw a tremendous rebound with the S&P 500 hitting record highs on June 27th, capping off a 24% rally from the April low.3Langley, Karen, and Krystal Hur. “Historic Rebound Sends S&P 500 to New Highs.” The Wall Street Journal, 27 June 2027, www.wsj.com/finance/stocks/historic-rebound-sends-s-p-500-to-new-highs-44775c62?. Trade negotiations are underway, and most tariff increases were pushed out to July 9th.4Lawder, David. “Trump Complains About US-Japan Trade Talks as Bessent Warns of Higher Tariffs.” Reuters, 27 June 2027, www.reuters.com/world/us/us-treasurys-bessent-warns-countries-face-higher-tariff-rates-after-july-9-2025-06-30. Corporate earnings were more resilient than initially feared, beating expectations by wide margins in the first quarter, led by tech companies like Intel.5Lazzaro, Nick, and Umer Khan. “Intel Posts Widest Q1 2025 EPS Beat Among S&P 500 Companies.” S&P Global Market Intelligence, 20 June 2025, www.spglobal.com/market-intelligence/en/news-insights/articles/2025/6/intel-posts-widest-q1-2025-eps-beat-among-sp-500-companies-90649220. The attacks on Iran’s nuclear facilities appear to have been successful and the ceasefire is holding.6Solomon, Jay. “Was Iran’s Nuclear Program ‘Obliterated’—or Just Set Back a Few Months?” The Free Press, 26 June 2025, www.thefp.com/p/was-irans-nuclear-program-obliterated-or-not-iran-israel-war-trump-strikes. The threat of nuclear war has diminished.
Every major index shown had positive returns in the second quarter, with several equity indices posting double-digit returns. Even with US equities’ strong comeback, they still trailed international returns in the second quarter, and by a sizeable margin when looking at the first half of the year.
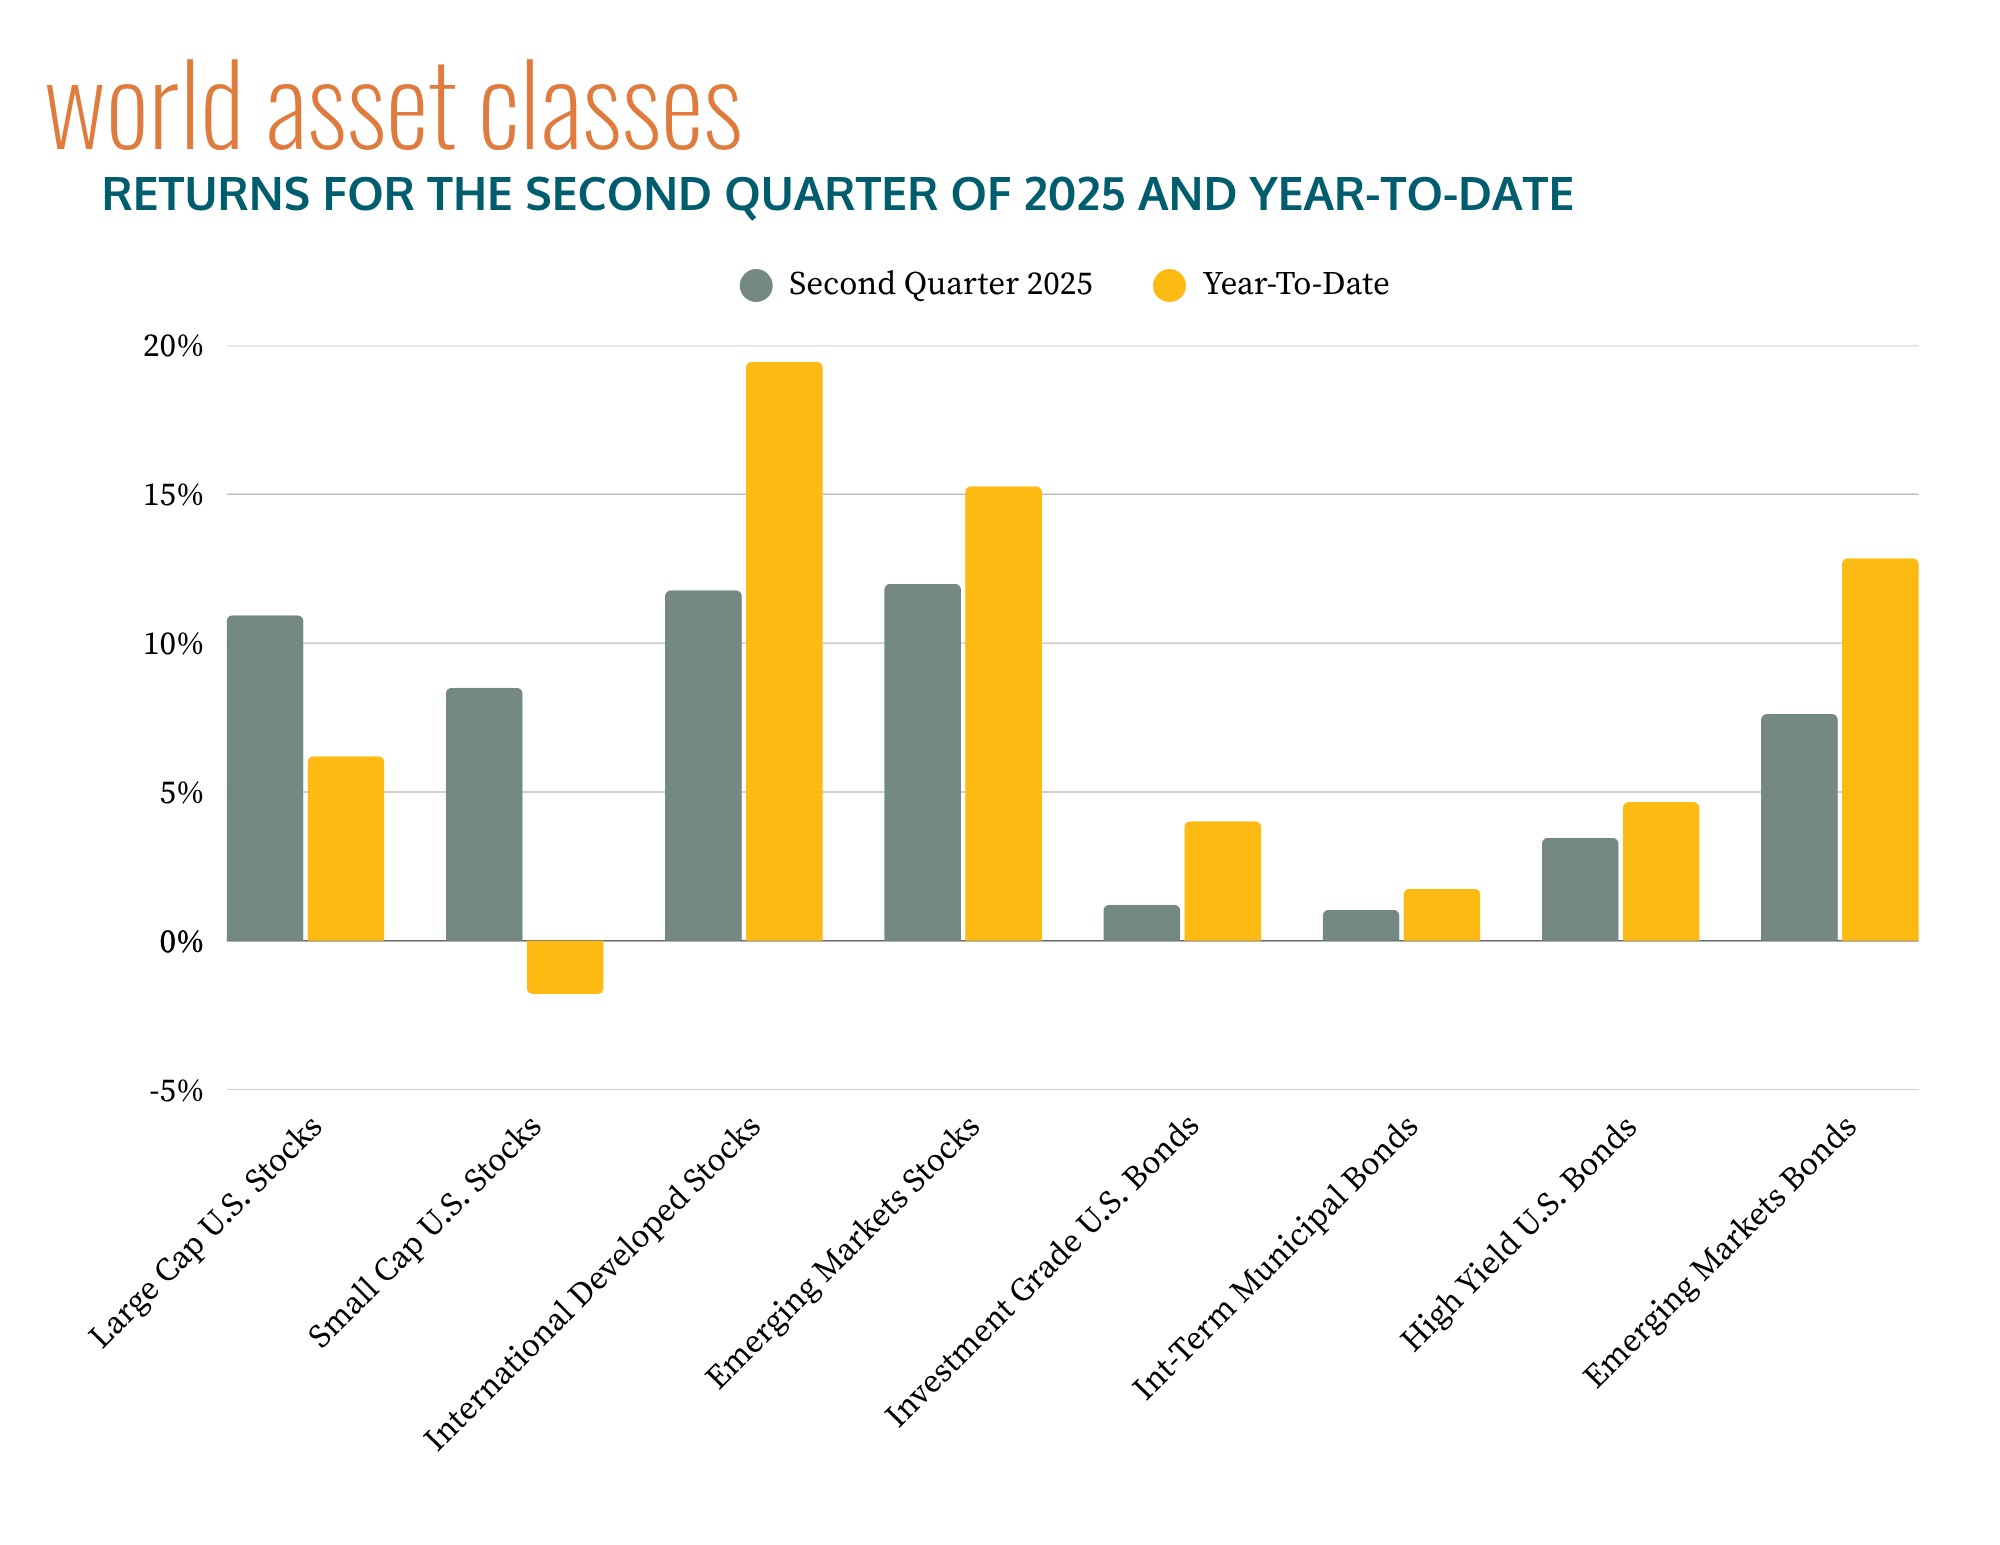
Source: Tamarac Reporting, Morningstar Direct and JP Morgan, as of 6/30/2025. Please see important disclosures below.
International equities (developed and emerging alike), outperformed US markets for the second quarter in a row behind a 7% drop in the US dollar relative to other currencies.7Source: Morningstar Direct. Data as of 6/30/2025. After periods where US equities drove global equity returns, international developed stocks have taken the lead in 2025, outpacing US stocks by roughly 13% year to date, a stark reminder of why it is prudent to stay diversified.
Despite modest yield volatility, investment grade bonds have continued to post positive returns for clients. Higher yielding bond sectors, such as high yield and emerging market bonds, were also additive in the second quarter, with emerging market bonds returning in double digits for the year.
While markets have pivoted from a bleak outlook to a more optimistic one, the uncertainties that drove markets down are not gone, just diminished. Some of the current optimism is driven by expectations, expectations that trade negotiations will continue and tariffs will not escalate, as well as expectations that the Fed will cut rates in the second half of the year. If those expectations turn sour, we could see volatility rise, reminding us that investing is unpredictable and sometimes difficult, but having a disciplined strategy makes navigating this dynamic world that much easier.
Important Disclosures
Team Hewins, LLC (“Team Hewins”) is an SEC registered investment adviser; however, such registration does not imply a certain level of skill or training, and no inference to the contrary should be made. We provide this information with the understanding that we are not engaged in rendering legal, accounting, or tax services. We recommend that all investors seek out the services of competent professionals in any of the aforementioned areas.
The volatilities of any comparative indices included in this presentation may be materially different from the individual performance attained by a specific client in a Team Hewins strategy. In addition, client holdings may differ significantly from the securities that comprise the indices. The indices have not been selected to represent an appropriate benchmark to compare an investor’s performance, but rather are disclosed to allow for comparison to the performances of certain well-known and widely recognized indices. The indices are unmanaged, include reinvestment of dividends, capital gain distributions or other earnings and do not reflect any fees or expenses. Indices cannot be invested in directly. Set forth below are descriptions of the indices included in the presentation.
Past performance is not an indication of future returns. Comments provided herein reflects Team Hewins’ views as of the date of this write up and are provided for informational purposes only. Such views are subject to change at any point without notice. Some of the information was obtained from third party sources believed to be reliable but the information is not guaranteed. Any forward-looking statements or forecasts are based on assumptions and actual results are expected to vary from any such statements or forecasts. Due to various risks and uncertainties no reliance should be placed on any such statements or forecasts when making any investment decision. Nothing presented herein is or intended to be investment advice or a recommendation to buy or sell any securities and no investment decision should be made based solely on the information provided. Team Hewins is not responsible for the consequences of any decisions or actions taken as a result of information provided in this writeup and does not warrant or guarantee the accuracy or completeness of the information. There is a risk of loss from an investment in securities, including the risk of loss of principal. Different types of investments involve varying degrees of risk, and there can be no assurance that any specific investment will be profitable or suitable for a particular investor’s financial situation or risk tolerance. Asset allocation and portfolio diversification cannot assure or guarantee better performance and cannot eliminate the risk of investment losses.
Source: © [2024] Morningstar. All Rights Reserved. The information contained herein: (1) is proprietary to Morningstar and/or its content providers; (2) may not be copied or distributed; and (3) is not warranted to be accurate, complete or timely. Neither Morningstar nor its content providers are responsible for any damages or losses arising.
Index returns for JPM GBI EM GD USD Unhedged Index (Emerging Markets Bonds) sourced from Tamarac Reporting and JP Morgan.
Index Descriptions
-
S&P 500 Index (Large Cap U.S. Stocks): measures the performance of large capitalization U.S. Stocks. It is a market-value-weighted index of 500 stocks that are traded on the NYSE, NYSE MKT, and NASDAQ. The weightings make each company’s influence on the Index performance directly proportional to that company’s market value.
-
Russell 2000 Index (Small Cap U.S. Stocks): An unmanaged index that measures the performance of the small-cap segment of the U.S. equity universe. It is a subset of the Russell 3000 Index, representing approximately 10% of the total market capitalization of that index and includes approximately 2,000 of the smallest securities based on a combination of their market cap and current index membership. Russell Investment Group owns the Russell Index data, including all applicable trademarks and copyrights.
-
MSCI EAFE Index (International Developed Stocks): The MSCI EAFE Index (Europe, Australasia, Far East) is a free float-adjusted market capitalization-weighted index that is designed to measure the equity market performance of developed markets, excluding the U.S. & Canada. The MSCI EAFE Index consists of the following 22 developed market country indices: Australia, Austria, Belgium, Denmark, Finland, France, Germany, Greece, Hong Kong, Ireland, Israel, Italy, Japan, the Netherlands, New Zealand, Norway, Portugal, Singapore, Spain, Sweden, Switzerland, and the United Kingdom.
-
MSCI Emerging Markets Index (Emerging Markets Stocks): is a Morgan Stanley Capital International Index that is designed to measure the performance of equity markets in 25 emerging countries around the world.
-
Bloomberg US Aggregate Bond Index (Investment Grade U.S. Bonds): includes U.S. government, corporate, and mortgage-backed securities with maturities of at least one year.
-
Bloomberg Muni Bond Index 1-10 Yr Blend (1-12) (Int-Term Municipal Bonds): A market value-weighted index which covers the short and intermediate components of the broader Bloomberg Capital Municipal Bond Index. The 1-10 Year Municipal Blend index tracks tax-exempt municipal General Obligation, Revenue, Insured, and Prerefunded bonds with a minimum $5 million par amount outstanding, issued as part of a transaction of at least $50 million, and with a remaining maturity from 1 up to (but not including) 12 years.
-
ICE BofA Merrill Lynch U.S. High Yield, BB-B Rated, Constrained Index (High Yield U.S. Bonds): Tracks the performance of US dollar-denominated below-investment-grade (BBB rated) corporate debt publicly issued in the US domestic market. Qualifying bonds are capitalization-weighted provided the total allocation to an individual issuer does not exceed 2%. Issuers that exceed the limit are reduced to 2% and the face value of each of their bonds is adjusted on a pro-rata basis.
-
JPM GBI EM GD USD Unhedged Index (Emerging Markets Bonds): A comprehensive global local emerging markets index that consists of regularly traded, liquid fixed-rate domestic currency government bonds.
- 1Source: Morningstar Direct. Data as of 6/30/2025.
- 2Cox, Jeff. “Core Inflation Rate Rose to 2.7% in May, More Than Expected, Fed’s Preferred Gauge Shows.” CNBC, 27 June 2025, www.cnbc.com/2025/06/27/pce-inflation-report-may-2025-.html.
- 3Langley, Karen, and Krystal Hur. “Historic Rebound Sends S&P 500 to New Highs.” The Wall Street Journal, 27 June 2027, www.wsj.com/finance/stocks/historic-rebound-sends-s-p-500-to-new-highs-44775c62?.
- 4Lawder, David. “Trump Complains About US-Japan Trade Talks as Bessent Warns of Higher Tariffs.” Reuters, 27 June 2027, www.reuters.com/world/us/us-treasurys-bessent-warns-countries-face-higher-tariff-rates-after-july-9-2025-06-30.
- 5Lazzaro, Nick, and Umer Khan. “Intel Posts Widest Q1 2025 EPS Beat Among S&P 500 Companies.” S&P Global Market Intelligence, 20 June 2025, www.spglobal.com/market-intelligence/en/news-insights/articles/2025/6/intel-posts-widest-q1-2025-eps-beat-among-sp-500-companies-90649220.
- 6Solomon, Jay. “Was Iran’s Nuclear Program ‘Obliterated’—or Just Set Back a Few Months?” The Free Press, 26 June 2025, www.thefp.com/p/was-irans-nuclear-program-obliterated-or-not-iran-israel-war-trump-strikes.
- 7Source: Morningstar Direct. Data as of 6/30/2025.