
The market rally from the fourth quarter of last year continued in the first quarter. The big picture for markets remains more or less the same; the Fed is expected to cut rates this year, just not as soon – and maybe not as much – as initially predicted.
Why the change? Inflation has been stickier than expected. After headline CPI inflation came down to 3.2% year-over-year in July 2023, the February 2024 CPI reading came in at the same 3.2%.(1) Energy prices, which have helped contribute to disinflation in recent months, swung the other way in the February reading. Unleaded gasoline is up around 14% since the start of the year, as winter storms have crimped US output and the OPEC+ cartel continues to cut production.(2) Job reports have also been unexpectedly hot to start the year, with the US adding 275,000 jobs in March, more than expected.(3)
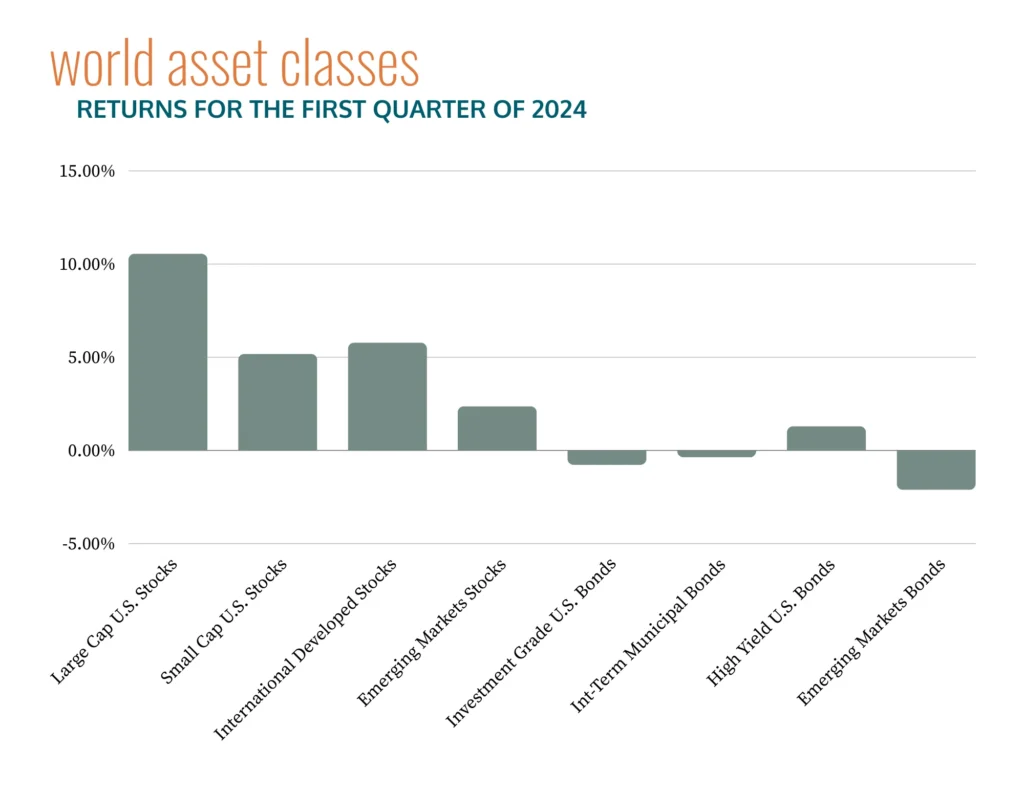
Stocks enjoyed a strong quarter, with most major indices returning over 5% in the first three months of the year. Bonds declined modestly, as recent inflation readings have contributed to the sense that rates will not decline as much as the market expected at the end of last year.
Source: Tamarac Reporting, Morningstar Direct and JP Morgan, as of 03/31/2024. Please see important disclosures below.
U.S. large cap stocks led in the first quarter, nearly doubling the returns seen in international markets and in smaller U.S. stocks. With this comes further concentration in the S&P 500, with the top 10 stocks making up 33.5% of the index at the end of the quarter.(4) However, these stocks are seeing mixed results. Nvidia and Meta are doing well, but others like Apple and Tesla are down double digits in 2024.(5) This is a good time to have exposure to the rest of the market, which isn’t nearly as concentrated, or as expensive, as U.S. large cap stocks.
Investment grade bonds and high-quality municipals were down slightly in the first quarter. The yield on the 10-year Treasury, which was as low as 3.87% this year, is around 4.39% right now.(6), while the 2-year Treasury is yielding about 4.7%, keeping the yield curve inverted as it has been for some time now.
While U.S. large cap stocks look expensive compared to historical averages, investors who follow a diversified program have captured those returns and also maintained exposure to other areas of the market that are not as concentrated and expensive. It is wise to be diversified.
[1] JPM Guide to the markets, slide 27. As of 3/31/24.
[2] Uberti, David. “Why Gasoline Prices Are Rising Faster Than Usual This Year.” The Wall Street Journal, 28 Mar. 2024, https://www.wsj.com/finance/commodities-futures/gas-prices-rising-2024-cause-86b864d7. Accessed 6 Apr. 2024.
[3] Roth Staffing. “March 2024 Job Report: U.S. Economy Added 275,000 Jobs.” Roth Staffing Companies, 8 Mar. 2024, https://www.rothstaffing.com/march-2024-job-report-u-s-economy-added-275000-jobs/#:~:text=The%20March%202024%20Jobs%20Report,rate%20has%20remained%20below%204.0%25. Accessed 4 Apr. 2024.
[4] JPM Guide to the markets, slide 10. As of 3/31/24.
[5] Krauskopf, Lewis. “How The US Stock Market Rocketed Through the First Quarter.” Reuters, 28 Mar. 2024, https://www.reuters.com/markets/us/how-us-stock-market-rocketed-through-first-quarter-2024-03-28/. Accessed 4 Apr. 2024.
[6] Treasury.gov. Data as of 4/2/24
Important Disclosures
Team Hewins, LLC (“Team Hewins”) is an SEC registered investment adviser; however, such registration does not imply a certain level of skill or training, and no inference to the contrary should be made. We provide this information with the understanding that we are not engaged in rendering legal, accounting, or tax services. We recommend that all investors seek out the services of competent professionals in any of the aforementioned areas.
The volatilities of any comparative indices included in this presentation may be materially different from the individual performance attained by a specific client in a Team Hewins strategy. In addition, client holdings may differ significantly from the securities that comprise the indices. The indices have not been selected to represent an appropriate benchmark to compare an investor’s performance, but rather are disclosed to allow for comparison to the performances of certain well-known and widely recognized indices. The indices are unmanaged, include reinvestment of dividends, capital gain distributions or other earnings and do not reflect any fees or expenses. Indices cannot be invested in directly. Set forth below are descriptions of the indices included in the presentation.
Past performance is not an indication of future returns. Comments provided herein reflects Team Hewins’ views as of the date of this write up and are provided for informational purposes only. Such views are subject to change at any point without notice. Some of the information was obtained from third party sources believed to be reliable but the information is not guaranteed. Any forward-looking statements or forecasts are based on assumptions and actual results are expected to vary from any such statements or forecasts. Due to various risks and uncertainties no reliance should be placed on any such statements or forecasts when making any investment decision. Nothing presented herein is or intended to be investment advice or a recommendation to buy or sell any securities and no investment decision should be made based solely on the information provided. Team Hewins is not responsible for the consequences of any decisions or actions taken as a result of information provided in this writeup and does not warrant or guarantee the accuracy or completeness of the information. There is a risk of loss from an investment in securities, including the risk of loss of principal. Different types of investments involve varying degrees of risk, and there can be no assurance that any specific investment will be profitable or suitable for a particular investor’s financial situation or risk tolerance. Asset allocation and portfolio diversification cannot assure or guarantee better performance and cannot eliminate the risk of investment losses.
Source: © [2023] Morningstar. All Rights Reserved. The information contained herein: (1) is proprietary to Morningstar and/or its content providers; (2) may not be copied or distributed; and (3) is not warranted to be accurate, complete or timely. Neither Morningstar nor its content providers are responsible for any damages or losses arising.
Index returns for JPM GBI EM GD USD Unhedged Index (Emerging Markets Bonds) sourced from Tamarac Reporting and JP Morgan.
Index Descriptions
-
S&P 500 Index (Large Cap U.S. Stocks): measures the performance of large capitalization U.S. Stocks. It is a market-value-weighted index of 500 stocks that are traded on the NYSE, NYSE MKT, and NASDAQ. The weightings make each company’s influence on the Index performance directly proportional to that company’s market value.
-
Russell 2000 Index (Small Cap U.S. Stocks): An unmanaged index that measures the performance of the small-cap segment of the U.S. equity universe. It is a subset of the Russell 3000 Index, representing approximately 10% of the total market capitalization of that index and includes approximately 2,000 of the smallest securities based on a combination of their market cap and current index membership. Russell Investment Group owns the Russell Index data, including all applicable trademarks and copyrights.
-
MSCI EAFE Index (International Developed Stocks): The MSCI EAFE Index (Europe, Australasia, Far East) is a free float-adjusted market capitalization-weighted index that is designed to measure the equity market performance of developed markets, excluding the U.S. & Canada. The MSCI EAFE Index consists of the following 22 developed market country indices: Australia, Austria, Belgium, Denmark, Finland, France, Germany, Greece, Hong Kong, Ireland, Israel, Italy, Japan, the Netherlands, New Zealand, Norway, Portugal, Singapore, Spain, Sweden, Switzerland, and the United Kingdom.
-
MSCI Emerging Markets Index (Emerging Markets Stocks): is a Morgan Stanley Capital International Index that is designed to measure the performance of equity markets in 25 emerging countries around the world.
-
Bloomberg Barclays US Aggregate Bond Index (Investment Grade U.S. Bonds): includes U.S. government, corporate, and mortgage-backed securities with maturities of at least one year.
-
Bloomberg Barclays Muni Bond Index 1-10 Yr Blend (1-12) (Int-Term Municipal Bonds): A market value-weighted index which covers the short and intermediate components of the Barclays Capital Municipal Bond Index. The 1-10 Year Municipal Blend index tracks tax-exempt municipal General Obligation, Revenue, Insured, and Prerefunded bonds with a minimum $5 million par amount outstanding, issued as part of a transaction of at least $50 million, and with a remaining maturity from 1 up to (but not including) 12 years.
-
ICE BofA Merrill Lynch U.S. High Yield, BB-B Rated, Constrained Index (High Yield U.S. Bonds): Tracks the performance of US dollar-denominated below-investment-grade (BBB rated) corporate debt publicly issued in the US domestic market. Qualifying bonds are capitalization-weighted provided the total allocation to an individual issuer does not exceed 2%. Issuers that exceed the limit are reduced to 2% and the face value of each of their bonds is adjusted on a pro-rata basis.
-
JPM GBI EM GD USD Unhedged Index (Emerging Markets Bonds): The JP Morgan EMBI Global Diversified is a uniquely weighted index that tracks total returns for U.S. dollar-denominated Brady bonds, Eurobonds, traded loans, and local market debt instruments issued by sovereign and quasi-sovereign entities. The index limits the weights of countries with larger debt stocks by only including a specified portion of these countries’ eligible current face amounts of debt outstanding.