
2020 was a year that no one will forget. A devastating pandemic wreaked havoc on our lives, and the resulting shelter in place orders wreaked havoc on the economy. US GDP dropped a historic 32.9% in the second quarter, and the unemployment rate peaked at 14.7%, a record outside the Great Depression.[1] It was also an unforgettable year for the global markets–but not for the reasons we would have thought back in April. This past year was a stark and humbling reminder that predicting the market is extremely difficult, if not impossible. In March, the S&P 500 lost around a third of its value in a very short time, and even though the index ended up 68% from its March 23rd low, much of that rally was concentrated in tech companies that thrived in a stay-at-home environment.[2]
Fast forward to November and the announcement of Pfizer vaccine trial results with an unexpectedly high efficacy rate. In the following weeks, Moderna and AstraZenaca/Oxford, also announced positive updates. Investors quickly went from looking at the near term to what the world would look like with the population largely vaccinated. In response, we saw a furious and much broader-based market rally:

In contrast to previous quarters, the segments of the equity markets that had been so maligned for much of the year–small cap and value–led the way in the fourth quarter.
Investors who were looking to an economic recovery that vaccines could usher in poured into small companies, which are generally believed to have higher expected returns. The change in sentiment was so profound that small cap companies actually ended the year ahead of their larger counterparts, after falling more in the first quarter decline.
Developed and emerging markets stocks also outpaced large cap US companies in the fourth quarter, although they lagged for the year. US investors’ returns overseas were helped by a weakening US dollar and greater economic activity in regions of the world where the virus was more contained.
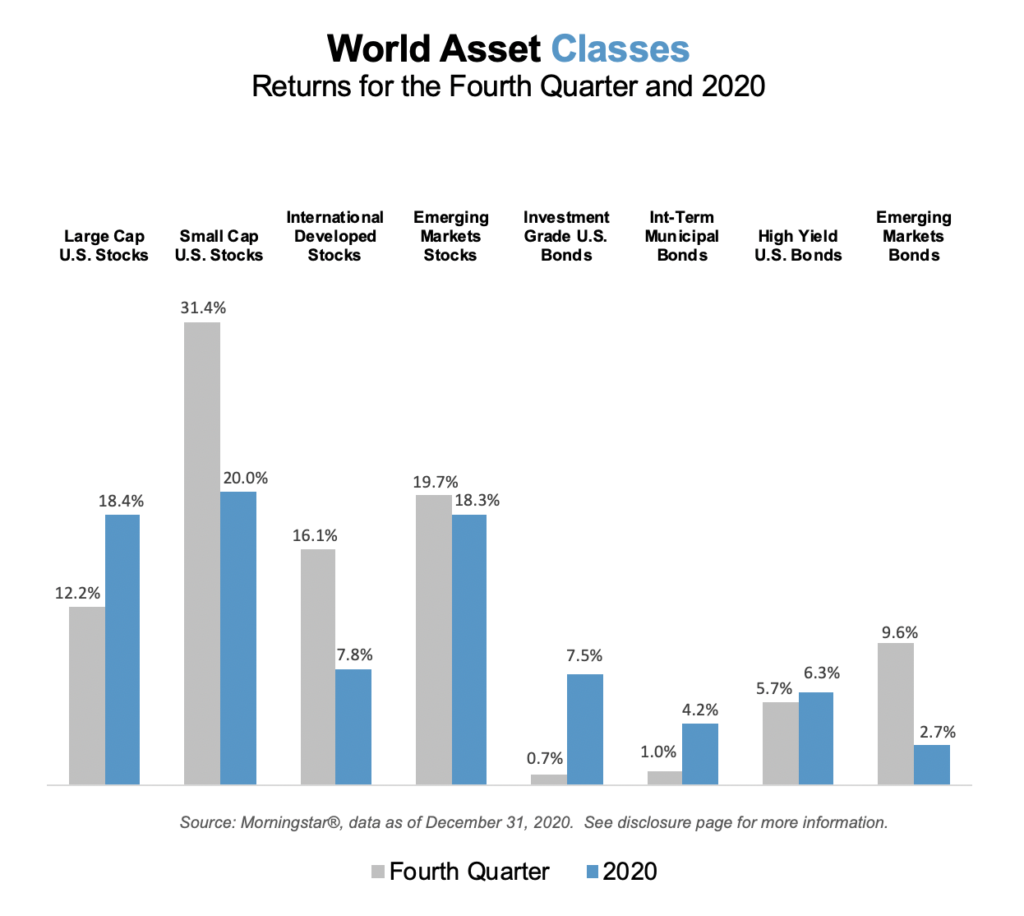
Value outperformed growth in the US and overseas, with investors eyeing how these sometimes more cyclical companies would fare in the post-vaccine recovery. In fact, as we are writing this letter, value has continued to do well in the first few days of January. However, value is still well behind growth when looking at the last twelve months.
In fixed income, US investment grade and municipal bonds posted more modest but solid returns once again. These high-quality bonds rose in part due to the historic drop in yields[3] brought on by the massive fiscal and monetary efforts of the US government to help ease the pain of the pandemic. Lower credit quality bonds, such as US high yield and emerging markets bonds had another strong quarter and both ended positive for the year, thanks to a furious fourth quarter rally (+10%) in emerging markets bonds.
2020 was a year of extraordinary surprises; those surprises initially generated enormous uncertainty and decline, but then came great relief and even exuberance. While volatility may subside to some degree once most of the world is inoculated with a vaccine, there will likely be other surprises (as there always are), hopefully nothing as dramatic as a pandemic. Maintaining strong discipline with a focus on long-term objectives helped investors through the volatile periods in 2020 and allowed them to participate in the market rally that few people saw coming. 2020 has once again taught us that market timing is a very tough game not worth playing.
[1] Jeff Cox, “Second-quarter GDP plunged by worst-ever 32.9% amid virus-induced shutdown”, CNBC, July 30, 2020.
[2] Amrith Ramkumar, “Investors Bet on ‘Everything Rally’”, Wall Street Journal, January 4, 2021.
[3] Thomas Franck and Yun Li, “10-year Treasury yield hits new all-time low of 0.318% amid historic flight to bonds”, CNBC, March 8, 2020.
Important Disclosures
Team Hewins, LLC (“Team Hewins”) is an SEC registered investment adviser; however, such registration does not imply a certain level of skill or training, and no inference to the contrary should be made. We provide this information with the understanding that we are not engaged in rendering legal, accounting, or tax services. We recommend that all investors seek out the services of competent professionals in any of the aforementioned areas.
The volatilities of any comparative indices included in this presentation may be materially different from the individual performance attained by a specific client in a Team Hewins strategy. In addition, client holdings may differ significantly from the securities that comprise the indices. The indices have not been selected to represent an appropriate benchmark to compare an investor’s performance, but rather are disclosed to allow for comparison to the performances of certain well-known and widely recognized indices. The indices are unmanaged, include reinvestment of dividends, capital gain distributions or other earnings and do not reflect any fees or expenses. Indices cannot be invested in directly. Set forth below are descriptions of the indices included in the presentation.
Past performance is not an indication of future returns. Comments provided herein reflects Team Hewins’ views as of the date of this write up and are provided for informational purposes only. Such views are subject to change at any point without notice. Some of the information was obtained from third party sources believed to be reliable but the information is not guaranteed. Any forward-looking statements or forecasts are based on assumptions and actual results are expected to vary from any such statements or forecasts. Due to various risks and uncertainties no reliance should be placed on any such statements or forecasts when making any investment decision. Nothing presented herein is or intended to be investment advice or a recommendation to buy or sell any securities and no investment decision should be made based solely on the information provided. Team Hewins is not responsible for the consequences of any decisions or actions taken as a result of information provided in this writeup and does not warrant or guarantee the accuracy or completeness of the information. There is a risk of loss from an investment in securities, including the risk of loss of principal. Different types of investments involve varying degrees of risk, and there can be no assurance that any specific investment will be profitable or suitable for a particular investor’s financial situation or risk tolerance. Asset allocation and portfolio diversification cannot assure or guarantee better performance and cannot eliminate the risk of investment losses.
Source: © [2021] Morningstar. All Rights Reserved. The information contained herein: (1) is proprietary to Morningstar and/or its content providers; (2) may not be copied or distributed; and (3) is not warranted to be accurate, complete or timely. Neither Morningstar nor its content providers are responsible for any damages or losses arising.
Index Descriptions
Dow Jones Industrial Average Index: measures the performance of 30 large, publicly-owned companies trading on the New York Stock Exchange (NYSE) and the NASDAQ.
Russell 3000 Index (U.S. Stock Market): measures the performance of the largest 3,000 U.S. companies representing approximately 98% of the investable U.S. equity market. These securities are traded on the NYSE, NYSE MKT, and NASDAQ.
S&P 500 Index (Large Cap U.S. Stocks): measures the performance of large capitalization U.S. Stocks. It is a market-value-weighted index of 500 stocks that are traded on the NYSE, NYSE MKT, and NASDAQ. The weightings make each company’s influence on the Index performance directly proportional to that company’s market value.
Russell 2000 Index (Small Cap U.S. Stocks): An unmanaged index that measures the performance of the small-cap segment of the U.S. equity universe. It is a subset of the Russell 3000 Index, representing approximately 10% of the total market capitalization of that index and includes approximately 2,000 of the smallest securities based on a combination of their market cap and current index membership. Russell Investment Group owns the Russell Index data, including all applicable trademarks and copyrights.
MSCI EAFE Index (International Developed Stocks): The MSCI EAFE Index (Europe, Australasia, Far East) is a free float-adjusted market capitalization-weighted index that is designed to measure the equity market performance of developed markets, excluding the U.S. & Canada. The MSCI EAFE Index consists of the following 22 developed market country indices: Australia, Austria, Belgium, Denmark, Finland, France, Germany, Greece, Hong Kong, Ireland, Israel, Italy, Japan, the Netherlands, New Zealand, Norway, Portugal, Singapore, Spain, Sweden, Switzerland, and the United Kingdom.
MSCI Emerging Markets Index (Emerging Markets Stocks): is a Morgan Stanley Capital International Index that is designed to measure the performance of equity markets in 23 emerging countries around the world.
Bloomberg Barclays US Aggregate Bond Index (U.S. Bond Market or Investment Grade U.S. Bonds): includes U.S. government, corporate, and mortgage-backed securities with maturities of at least one year.
Bloomberg Barclays Muni Bond Index 1-10 Yr Blend (1-12) (Int-Term Municipal Bonds or US Municipal Bonds): A market value-weighted index which covers the short and intermediate components of the Barclays Capital Municipal Bond Index. The 1-10 Year Municipal Blend index tracks tax-exempt municipal General Obligation, Revenue, Insured, and Prerefunded bonds with a minimum $5 million par amount outstanding, issued as part of a transaction of at least $50 million, and with a remaining maturity from 1 up to (but not including) 12 years.
ICE BofA Merrill Lynch U.S. High Yield, BB-B Rated, Constrained Index (High Yield U.S. Bonds): Tracks the performance of US dollar-denominated below-investment-grade (BBB rated) corporate debt publicly issued in the US domestic market. Qualifying bonds are capitalization-weighted provided the total allocation to an individual issuer does not exceed 2%. Issuers that exceed the limit are reduced to 2% and the face value of each of their bonds is adjusted on a pro-rata basis.
JPM GBI EM GD USD Unhedged Index (Emerging Markets Bonds): The JP Morgan EMBI Global Diversified is a uniquely weighted index that tracks total returns for U.S. dollar-denominated Brady bonds, Eurobonds, traded loans, and local market debt instruments issued by sovereign and quasi-sovereign entities. The index limits the weights of countries with larger debt stocks by only including a specified portion of these countries’ eligible current face amounts of debt outstanding.
JPM EMBI GD Index: J.P. Morgan Emerging Markets Bond Global Diversified Index (EMBI Global Diversified) tracks the returns for U.S. dollar-denominated debt instruments issued by emerging market sovereign and quasi- sovereign entities: Brady bonds, loans, Eurobonds. The index limits the exposure of some of the larger countries.